Group Abstract Group Abstract

Message Boards Message Boards

0
|
17K Views
|
10 Replies
|
3 Total Likes
View groups...
Share
Share this post:

Filling to vertical axis

POSTED BY: Malcolm Woodruff
10 Replies

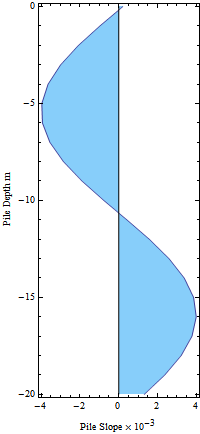
Okay, here is how I would draw it with my Presentations application. It's an example of working more with primitives than trying to modify a top-down design. ListLineDraw is like ListLinePlot except that it just returns the primitive graphics elements of the object being drawn without all the frame items. RotateOp is like Rotate except you can use it directly like a postfix operator without all the graphics to be rotated embedded in the middle. CustomTicks allows you to specify your own ticks and subticks. I used it here to reverse the y-axis. I also drew a line for the vertical Pile Slope axis. It could just be mixed in with the other primitives. No Epilog or Graphics level jumping.

<< Presentations`

f[x_] := 4 Sin[0.3 (x + 10 \[Degree])]
fdata = Table[{x, f[x]}, {x, -20, 0, 1}];

yticks = CustomTicks[-# &, {-20, 0, 5, 5}];
Draw2D[
 {{ListLineDraw[fdata,
     Filling -> Axis,
     FillingStyle -> ColorData["Legacy"]["LightSkyBlue"]],
    Line[{{-20, 0}, {0, 0}}]} // RotateOp[-\[Pi]/2, {0, 0}]},
 Frame -> True,
 FrameTicks -> {{yticks, yticks // NoTickLabels}, {Automatic, 
    Automatic}},
 FrameLabel -> {"Pile Slope \[Times] \!\(\*SuperscriptBox[\(10\), \
\(-3\)]\)", "Pile Depth m" },
 ImageSize -> 200]

enter image description here

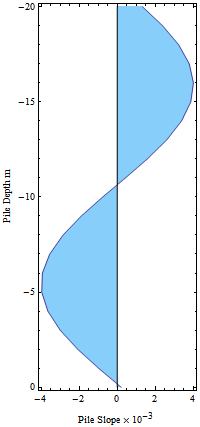
I realized that the above solution leaves out a needed reflection but that's easy to fix. Just add it after the rotation. One of the advantages of always dealing with primitives is that we can not only easily combine them - just draw one thing after another - but we can also easily manipulate them, individually if necessary.

Draw2D[
 {{ListLineDraw[fdata,
      Filling -> Axis,
      FillingStyle -> ColorData["Legacy"]["LightSkyBlue"]],
     Line[{{-20, 0}, {0, 0}}]} // RotateOp[-\[Pi]/2, {0, 0}] // 
   ReflectionMatrixOp[{0, 1}]},
 Frame -> True,
 FrameTicks -> Automatic,
 FrameLabel -> {"Pile Slope \[Times] \!\(\*SuperscriptBox[\(10\), \
\(-3\)]\)", "Pile Depth m" },
 ImageSize -> 200]

enter image description here

Hello Malcom, What is your goal here? Is it to learn how to make Mathematica create the plot, or is it to get the plot and move on to publishing it in a different medium?

If it is the later, I usually Export a plot without labels as an .svg (scalable vector graphics) and then import it into an svg editing program such as Inkscape (free) or Adobe illustrator (commercial). This is what I do if it is a one-off and in a hurry.

If the later, you might look at using rotated text to get what you want. There is an example of doing this in the Barchart documentation examples.

POSTED BY: W. Craig Carter

If you have a "curve" that bounds the left axis and the upper horizontal boundry of the graph then you can fill to that. Here is an example:

Plot[
 {10 UnitStep[x], x}, {x, 0, 10}, Filling -> {1 -> {2}}, 
 PlotStyle -> {Directive[Opacity[0]], Directive[Red]}]

and

Plot[
 {100 UnitStep[x], x^2}, {x, 0, 10}, Filling -> {1 -> {2}}, 
 PlotStyle -> {Directive[Opacity[0]], Directive[Red]}]

You just have to get the coefficient of UnitStep correct for this to work.

POSTED BY: David Reiss

David I am sorry I did not get time to send a set of sample data but I have been out since my last post. Your solution looks to be just what I need. Many thanks.

Craig Thank you. Yes I sometimes output to CAD program and mark up from there but this particular case is for a program so will be used constantly. Davids solution looks great for this

POSTED BY: Malcolm Woodruff

Why don't you give us a sample set of data so we don't have to make it up?

POSTED BY: Malcolm Woodruff

How would this be? You can place the left edge wherever you wish.

f[y_] := 3 + y Cos[y]
RegionPlot[-1 <= x <= f[y] && 0 <= y <= 4, {x, -2, 4}, {y, 0, 4},
 PlotRange -> {{-2, 4}, {-0.2, 4.5}},
 Frame -> True,
 ImageSize -> 300]

enter image description here

That does not seem to work either. Perhaps because I am using ListLinePlot for my graph? I get an unknown option error.

POSTED BY: Malcolm Woodruff

You can get the vertical lines on a plot by using

Exclusions -> None
POSTED BY: S M Blinder

David Thank you but if the curve starts further along the x axis than the origin it does not work. See

Plot[{100 UnitStep[x], x^2}, {x, 2, 10}, Filling -> {1 -> {2}}, 
 AxesOrigin -> {0, 0}, 
 PlotStyle -> {Directive[Opacity[0]], Directive[Red]}]
POSTED BY: Malcolm Woodruff
Reply to this discussion
Community posts can be styled and formatted using the Markdown syntax.
Reply Preview
Attachments
Remove
or Discard