Message Boards Message Boards

0
|
6386 Views
|
1 Reply
|
1 Total Likes
View groups...
Share
Share this post:

How to plot a two-dimensional Integral function

Posted 10 years ago

I am just a beginner with Mathematica. I need to plot (and later, to evaluate) a 2D function (g[d,lambda]) whose variables appear both in the argument of a triple integral and the limits, as follows:

fprobability[x_, y_, z_] := Exp[-Sqrt[y^2 + (z - x)^2]/gamma]

g[d_,lambda_]:= Integrate[fprobability[x, y, z], {x, 0, d}, {y, -Infinity, Infinity}, {z, 0,   d}]

Any clue?

POSTED BY: Enrique Ortega

Hi Enrique,

Here's a suggestion.

fprobability[x_, y_, z_] := Exp[-Sqrt[y^2 + (z - x)^2]/0.1];
g[d_, lambda_] := NIntegrate[fprobability[x, y, z], {x, 0, d}, {y, -Infinity, Infinity}, {z, 0, d}, AccuracyGoal -> 5];
Plot3D[g[d, lambda], {d, 0, 1}, {lambda, 0, 1}]

The output is

enter image description here

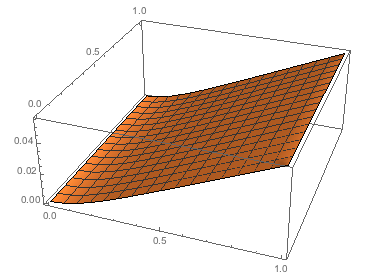
So basically, I gave Mathematica a value for "gamma", without which numerical integration would not work, and secondly I used numerical integration, i.e. NIntegrate.

Cheers,

M.

POSTED BY: Marco Thiel
Reply to this discussion
Community posts can be styled and formatted using the Markdown syntax.
Reply Preview
Attachments
Remove
or Discard

Group Abstract Group Abstract