Message Boards Message Boards

1
|
6412 Views
|
5 Replies
|
4 Total Likes
View groups...
Share
Share this post:

Odd coloring of ContourPlot

Posted 10 years ago

Hello all,

The code below details a behavior of ContourPlot (as well as ListContourPlot) which I find inconvenient, and don't understand. It has to do with how the color is chosen for the region of values above the last drawn contour. Does anyone understand this? And know how to avoid it?

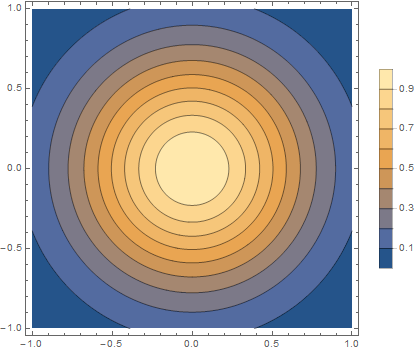
Here is a test function -- a Gaussian with a max value of 1. It plots as expected:

p1 = ContourPlot[Exp[ 2 (-x^2 - y^2)], {x, -1, 1}, {y, -1, 1}, 
  Contours -> Range[.1, 1, .1], PlotLegends -> Automatic, 
  PlotPoints -> 100]
enter image description here

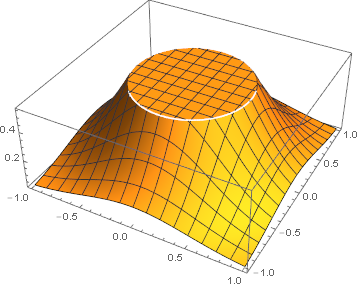
We can truncate it to produce a plateau at 0.55:

p2 = Plot3D[Min[Exp[ 2 (-x^2 - y^2)], 0.55], {x, -1, 1}, {y, -1, 1}, 
enter image description here

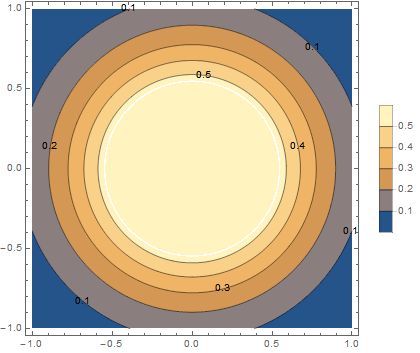
And it plots as expected. Note that the region above the 0.5 contour plots in the expected color.

p3 = ContourPlot[
  Min[Exp[ 2 (-x^2 - y^2)], 0.55], {x, -1, 1}, {y, -1, 1}, 
  Contours -> Range[.1, 1, .1], PlotLegends -> Automatic, 
  PlotPoints -> 100, ContourLabels -> All]
enter image description here

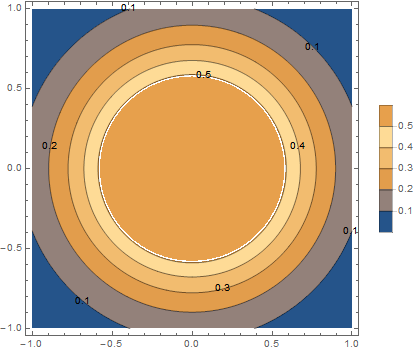
But if we create the plateau at 0.51, we get a very different result. It looks like it has colored the region from 0.5 to 0.51 as expected, but then reused the color for 0.2 to 0.3 for the values of 0.51 in the plateau.

p4 = ContourPlot[
  Min[Exp[ 2 (-x^2 - y^2)], 0.51], {x, -1, 1}, {y, -1, 1}, 
  Contours -> Range[.1, 1, .1], PlotLegends -> Automatic, 
  PlotPoints -> 100, ContourLabels -> All]
enter image description here

POSTED BY: David Keith
5 Replies

Adding ColorFunctionScaling->False makes the incongruity go away - the other contours are darker.

The coloring behavior is incorrect. Roughly similar problem reports exist.

POSTED BY: Bruce Miller
Posted 10 years ago

Thanks, Bruce. That sort of works, but I still get the white ring anomaly. I noticed later that I reported something similar 8 months ago, and had forgotten. At that time I was creating graphics for a client report and it was driving me crazy. It would be really nice to see this fixed.

enter image description here

POSTED BY: David Keith

Hi David,

regarding that white ring: Try the option "Exclusions -> None"

Henrik

POSTED BY: Henrik Schachner

I've had to resort to a related trick when my contours contain singularities:

Notice that I don't use the Min in the ContourPlot argument, but set it with PlotRange.

p4 = ContourPlot[Exp[2 (-x^2 - y^2)], {x, -1, 1}, {y, -1, 1}, 
  Contours -> Range[.1, 1, .1], PlotLegends -> Automatic, 
  ColorFunction -> "Temperature", PlotPoints -> 100, 
  ContourLabels -> All, PlotRange -> {0, 0.51},
  ColorFunctionScaling -> False, 
  ClippingStyle -> ColorData["Temperature"][0.51]]

enter image description here

For example compare:

ContourPlot[1/(1 - Exp[2 (-x^2 - y^2)]), {x, -1, 1}, {y, -1, 1}, 
 PlotLegends -> Automatic, ColorFunction -> "Temperature", 
 PlotPoints -> 100, ContourLabels -> All, PlotRange -> {0, 10}]

enter image description here to

ContourPlot[1/(1 - Exp[2 (-x^2 - y^2)]), {x, -1, 1}, {y, -1, 1}, 
    PlotLegends -> Automatic, ColorFunction -> "Temperature", 
    PlotPoints -> 100, ContourLabels -> All, PlotRange -> {0, 10},
    ClippingStyle -> ColorData["Temperature"][1]]

enter image description here

POSTED BY: W. Craig Carter
Posted 10 years ago

Thanks very much, guys. This will be useful.

POSTED BY: David Keith
Reply to this discussion
Community posts can be styled and formatted using the Markdown syntax.
Reply Preview
Attachments
Remove
or Discard

Group Abstract Group Abstract