Message Boards Message Boards

0
|
20728 Views
|
2 Replies
|
3 Total Likes
View groups...
Share
Share this post:

Plotting x and y asymptotes of a rational function

Posted 10 years ago

Hello,

I've been trying to plot this rational function and illustrate the asymptotes of it, but I don't know how to get both the asymptotes plotted in together with the function.

f(x_):=(3x-1)/(2x+6)

The plot I am trying to make in Mathematica

POSTED BY: Torjus Iveland
2 Replies

You get a graph like that with

f[x_] := (3 x - 1)/(2 x + 6);
Plot[{f[x], 3/2}, {x, -11, 7}, Exclusions -> {x == -3}, 
 ExclusionsStyle -> Red, PlotStyle -> {Black, Red}, PlotRange -> 10, 
 AspectRatio -> Automatic]

You can insert the labels with Epilog:

f[x_] := (3 x - 1)/(2 x + 6);
Plot[{f[x], 3/2}, {x, -11, 7}, Exclusions -> {x == -3}, 
 ExclusionsStyle -> Red, PlotStyle -> {Black, Red}, PlotRange -> 10, 
 AspectRatio -> Automatic, 
 Epilog -> {Text[x == -3, {-5, -8}], Text[y == 1.5, {5, 2}]}]
POSTED BY: Gianluca Gorni

Hi Torjus, I had a quick look, and there are a few ways of doing this. When you just plot the function like this:

Plot[(3 x - 1)/(2 x + 6), {x, -10, 6}]

you get an output with the vertical asymptote:
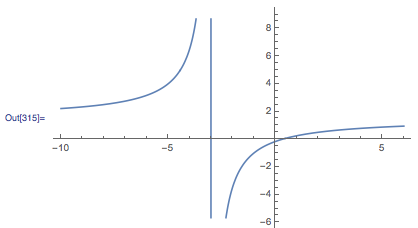
First method

You can then just add another function to plot of 1.5, like this:

Plot[{(3 x - 1)/(2 x + 6), 1.5}, {x, -10, 6}]

This is fine, but if you want both asymptotes to be a different graphics primitive we will have to try something else. You can also use GridLines, though I find this a bit clunky:

Plot[(3 x - 1)/(2 x + 6), {x, -10, 6},GridLines->{{-3,0},{0,1.5}}]
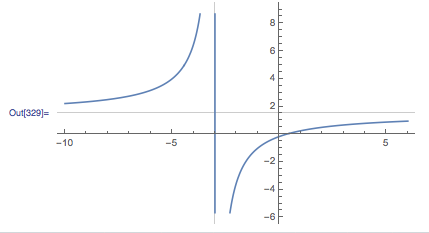
GridlLines method

OK, so now we have both asymptotes, but still the vertical one from the original plot. To stop this from showing up use Exclusions (an option in plot):

Plot[(3 x - 1)/(2 x + 6), {x, -10, 6},Exclusions->{x==-3},GridLines->{{-3,0},{0,1.5}}]

Another way, and my preferred method, is to use the option Epilog to add a Line primitive onto the plot. You can then style the asymptotes separately to make them more clear:

Plot[{(3 x - 1)/(2 x + 6), 1.5}, {x, -10, 6}, 
 PlotStyle -> {Black, Red}, Exclusions -> {x == -3}, 
 Epilog -> {Red, Line[{{-3, -100}, {-3, 100}}]}]
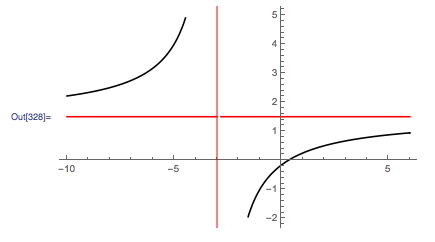
Epilog method

From here, you can use labelling options to add in your asymptote labels.

I hope this helps!

Nia Knibbs Vaughan

Reply to this discussion
Community posts can be styled and formatted using the Markdown syntax.
Reply Preview
Attachments
Remove
or Discard

Group Abstract Group Abstract