Message Boards Message Boards

6
|
16693 Views
|
5 Replies
|
19 Total Likes
View groups...
Share
Share this post:

Using Map projections with Astronomical data

Posted 10 years ago

I noticed that all important "Geoprojections" are available in projections for spherical reference models: GeoProjectionData function.

1 - How can I use the sinusoidal projection using astronomical data ? I want to use the frames of this projection to plot astronomical points in that map , using right ascension and declination as the coordinates, both in degrees.

2 - And what about the Hammer-Aitoff Equal-Area Projection? If that projection is not available, how do I make an astronomical plot using the equations ( also doing ticks, axis, frames, etc..)?

In the link below is data that can be used. The format is { {RA,DEC, Velocity},....}. Just need the RA, DEC parameters.

So DataSample

EDIT 1:

I did some tries, after reading maps and cartographies from Wolfram help:

> GeoGraphics[{}, GeoRange -> All, GeoProjection -> "Sinusoidal",  
> GeoGridLines -> Automatic,   GeoGridLinesStyle -> Directive[Thin,
> Dashed, Yellow],   GeoBackground -> Black, Frame -> True]

And the result is:

SInusoidalMap

But I need to insert the point data and make the coordinates range going -90 to 90 and 0 to 360

And one more challenge, I want to use a color range for every point using the parameter (Velocity). Is that possible?

EDIT 2:

Thanks to bbgodfrey, we did this (http://mathematica.stackexchange.com/questions/72426/using-map-projections-with-astronomical-data):

Sinusoidal Mapping

Wolfram developers, don t you think it is time to create specific plotting functions for the astronomy area?

POSTED BY: Marcelo De Cicco
5 Replies

Thanks Jeff.

POSTED BY: Marcelo De Cicco

To add to Jose's response, if you want to color the points different colors efficiently, you can redefine p as follows (there may be a shorter way, but this works):

p = With[{triples = 
    Cases[rad, {a_, b_, c_?NumberQ} :> {b, Mod[a, 360, -180], c}]}, 
  triples /. {a_, b_, c_} :> {a, b, 
     Rescale[c, {Min[triples[[All, 3]]], Max[triples[[All, 3]]]}]}];

Then, you can generate colors for each of the triples:

colors = ColorData["TemperatureMap"][#] & /@ p[[All, 3]];

The colors can be efficiently applied using VertexColors on the Point primitive:

GeoGraphics[{PointSize[0.01], 
  Point[GeoPosition[p[[All, 1 ;; 2]]], VertexColors -> colors]}, 
 GeoRange -> All, GeoProjection -> "Sinusoidal", 
 GeoGridLines -> Automatic, 
 GeoGridLinesStyle -> Directive[Dashing[{.01, .005}], Green], 
 GeoBackground -> Black]
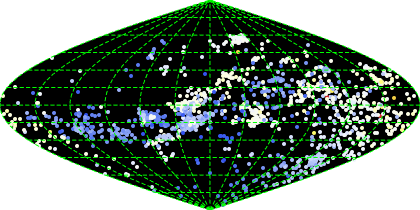
enter image description here

POSTED BY: Jeffrey Bryant
Posted 10 years ago

Just a note:

triplets[[;;, 3]] = Rescale @ triplets[[;;, 3]]

will be faster.

POSTED BY: Kuba Podkalicki

Fine! And what about colorizing the points? In geographic functions is allowed to do this?

See these other results from Kuba:

Kuba `s way

POSTED BY: Marcelo De Cicco

Starting from your proposed solution I would suggest the following simplification. A single GeoGraphics can produce the desired output and handles everything related to the projection. In version 10.0.2 GeoProjectionData also has the "Hammer" (or Hammer-Aitoff) and "Aitoff" projections.

rad = Import["~/Downloads/DadosRad2014_RADECVELOC_15124_1024.dat"];
p = Cases[rad, {a_, b_, c_} -> {b, Mod[a, 360, -180]}];

GeoGraphics[{Red, PointSize[0.01], Point[GeoPosition[p]]}, 
 GeoRange -> All, GeoProjection -> "Sinusoidal", 
 GeoGridLines -> Automatic, GeoGridLinesStyle -> Directive[Dashing[{.01, .005}], Green], 
 GeoBackground -> Black
]

enter image description here

Reply to this discussion
Community posts can be styled and formatted using the Markdown syntax.
Reply Preview
Attachments
Remove
or Discard

Group Abstract Group Abstract