Message Boards Message Boards

9
|
26753 Views
|
6 Replies
|
42 Total Likes
View groups...
Share
Share this post:

New fractal curve from golden ratio: how to generate Harriss spiral?

Posted 10 years ago

The Guardian recently published a piece about a new fractal curve discovered by an artist and math professor from the University of Arkansas. I looked online but did not find any more detailed information or CODE to generate the curve. Can anyone come up with a program that draws the Harriss spiral? Here is how it looks:

enter image description here

And here is the process behind building it. The golden rectangle:

enter image description here

A golden rectangle is a rectangle whose sides are proportioned according to the golden ratio, which is 1.618. In other words, the long side is 1.618 times the size of the short side. What is particularly interesting, however, about a golden rectangle is that if you draw a square inside it, as above, the remaining section (in blue) is a smaller golden rectangle. Let’s continue. We can divide the smaller rectangle into a square and an even smaller golden rectangle:

enter image description here

We can go on for as long as we like subdividing rectangles. And if we draw quarter circles in each square we get a spiral. The illustration below is probably one of the most famous images in mathematics, if not in all of science. The curve is called the “golden spiral”:

enter image description here

Inspired by the classic construction of the golden spiral, Harriss – who is British – began to play around with the process of subdividing rectangles in the hope that he would be able to generate other aesthetically pleasing curves. So, rather than starting with a rectangle and then cutting out a square that leaves a similar rectangle, as we did above with a golden rectangle, he did something subversive. “Instead of cutting a square, I cut a rectangle,” he said. What he did was this: he found the rectangle that would divide into two similar rectangles and a square, as illustrated below. The blue rectangle and the orange rectangle have the same proportions as the overall rectangle, which is a ratio between the sides of 1.325.

enter image description here

Since we have two of these rectangles, we can carry on subdividing. And again. And again.

enter image description here

enter image description here

enter image description here

So any takers for a Wolfram Language implementation?

POSTED BY: Vitaliy Kaurov
6 Replies

Unfortunately no, I would like to know how to build those myself. Picture is simply form the website linked by Vitaliy.

POSTED BY: Sam Carrettie

Sam, would you happen to have the programs or algorithms for those other figures? At the bottom, the one on the left would fit in Nightmare Before Christmas, and the middle one would be perfect for The Book Of Kells.

Here is an old piece of code from many years ago that does something similar:

circlesOnCircles[?_, ?_, ?_, iter_] :=
Module[{C, ?, cp, \[ScriptD], ?, ?},
C[?[mp_, r_, {?_, ?_}, -1, i_]] :=
(cp = mp + r (\[ScriptD] = {Cos[?], Sin[?]});
? = ?.{r, 1/i}; ? = ?.{? - ?, i};
{?[cp + \[ScriptD] ?, ?, {? - Pi - ?, ? - Pi}, 1, i + 1],
 ?[cp - \[ScriptD] ?, ?, {?, ? + ?}, -1, i + 1]});
C[?[mp_, r_, {?_, ?_}, 1, i_]] :=
(cp = mp + r (\[ScriptD] = {Cos[?], Sin[?]});
? = ?.{r, 1/i}; ? = ?.{? - ?, i};
{?[cp + \[ScriptD] ?, ?, {? - Pi, ? - Pi + ?}, -1, i + 1],
 ?[cp - \[ScriptD] ?, ?, {? - ?, ?}, 1, i + 1]});
Graphics[#, PlotRange -> All]& @
{Flatten[MapIndexed[{Thickness[0.01/#2[[1]]], Circle @@ Take[#,3]&/@#}&,
NestList[Flatten[C /@ #]&,
    Join[?[{0, 0}, 1, ?{-1, 1} Pi/2, #, 1]& /@ {-1, 1},
         ?[{2, 0}, 1, Pi + ?{-1, 1} Pi/2, #, 1]& /@ {-1, 1}], iter]]]}]

Manipulate[
           circlesOnCircles[?, ?, ?, iter] /.
 If[dcq, c_Circle :> {Opacity[op], Disk @@ c}, {}],
           {{iter, 5, "iterations"}, 1, 10, 1, ImageSize -> Small,
 Appearance -> "Labeled"},
          Delimiter,
             {{?, 1, "start segments"}, 0.1, 2,
 ImageSize -> Small},
           {{?, {0.37, 0.25}, "radii"}, {0, 0}, {2, 2},
 ImageSize -> Small},
           {{?, {0.17, 0.31}, "opening\nangles"}, {0, 0}, {1,
  1}, ImageSize -> Small},
          Delimiter,
         Row[{Control[{{dcq, False, "fill"}, {True, False}}], "  ",
  Control[{{op, 0.4, ""}, 0, 1, ImageSize -> Small}]}],
ControlPlacement -> Left]
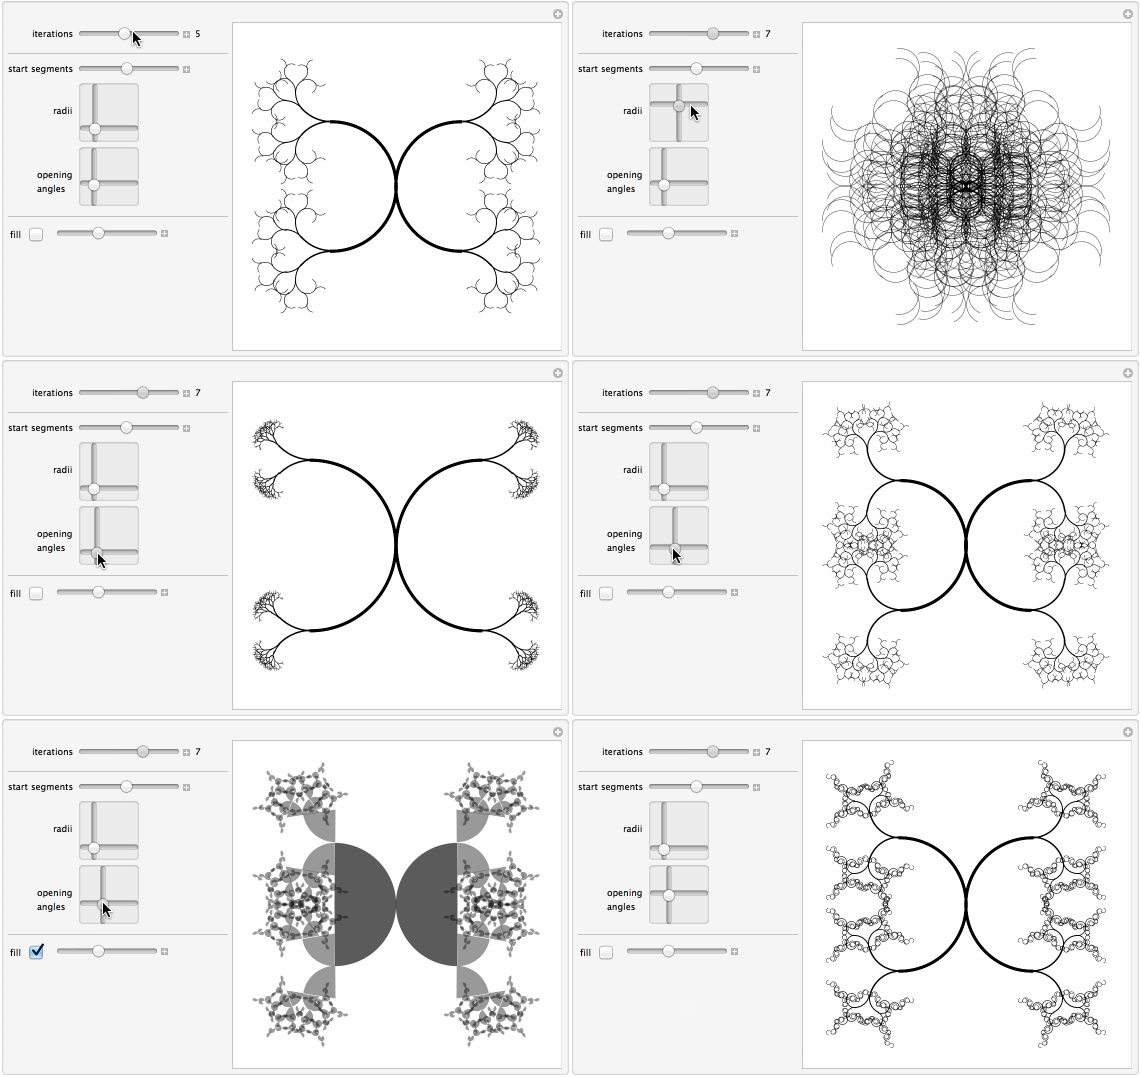
enter image description here

Attachments:
POSTED BY: Michael Trott

Thanks Sam.

1) Yes, it would be possible to use AffineTransform here to do the rescalings+rotations+shifts I do manually above. And the code would look simpler and neater. I did it this way because then I can reuse the points r, s, t to do tests and variations during the iteration.

2) As far as I see, the construction given above is fine tuned to place the rectangles in particular places, so that the quarter circles match, producing a continuous result. Changing the values of A and B would break that. As the author shows, it is possible to produce other spirals of this type by careful choice of how to replicate the rectangles (that means changing the affine transforms in the code). It would be great to find some continuous parameters that allow interpolation among (at least some of) those alternative spirals. Perhaps one would have to relax the rule of using only quarter circles for the curves.

This is spectacular, Jose! I am trying to understand the code, but would like to ask a few questions.

1) I know iterated function systems (IFS) can be generated with AffineTransform - is there any advantage of using AffineTransform here (if it is possible)?

2) Can your code generate other spirals (via A and B values maybe)? - quoting from the end of the article:

I asked if Harriss had looked for nice spirals with any of the other ratios? “Yes, but with limited success,” he sighed. “The problem is getting a set of squares that matches up in a nice order.” Here’s what he has come up with so far:

enter image description here

POSTED BY: Sam Carrettie

The sides of the Harriss rectangle assuming the basic square has side 1:

{A, B} = N[{a, b} /. Solve[a/b == b/(a - 1) == 1/(b - 1), {a, b}][[1]]]

{2.32472, 1.75488}

A/B

1.32472

Recursive code. eps is a discretization to stop the iteration. The second argument tells whether we want to show the discretization process or not. p and q in the recursive function are the corners of the next rectangle to be subdivided:

HarrissSpiral[eps_, squares_] := 
  Graphics[{EdgeForm[Black], 
    HarrissSpiralStep[{0, 0}, {A, B}, eps, squares]}, 
   AspectRatio -> Automatic];
HarrissSpiralStep[p_, q_, eps_, squares_] := 
 If[EuclideanDistance[p, q] > eps,
  With[{
    r = p + (A - 1)/
        Sqrt[A^2 + B^2] RotationMatrix[-ArcTan[A, B]].(q - p),
    s = p + B/Sqrt[A^2 + B^2] RotationMatrix[ArcTan[B, A]].(q - p),
    t = p + Sqrt[1 + (A - 1)^2]/Sqrt[A^2 + B^2] (q - p)},
   {If[squares,
     {
      Black, Arrow[{p, q}],
      White, Rectangle[p, q],
      Blue, Rectangle[r, s],
      Orange, Rectangle[t, q]
      },
     {}
     ],
    Red, AbsoluteThickness[5 Norm[s - p]], 
    Circle[p + RotationMatrix[-Pi/4].(s - p)/Sqrt[2], 
     Norm[s - p]/Sqrt[2], ArcTan @@ (s - p) + {Pi/4, 3 Pi/4}],
    HarrissSpiralStep[r, s, eps, squares],
    HarrissSpiralStep[t, q, eps, squares]
    }],
  {}
  ]

Only a few iterations:

HarrissSpiral[0.8, True]

enter image description here

More iterations:

HarrissSpiral[0.1, True]

enter image description here

Show only the quarter circles:

HarrissSpiral[0.02, False]

enter image description here

To understand the idea, the key is to follow the arrows, which determine the orientation of the rectangles. There is a blue or orange rectangle and a quarter circle per arrow. Some arrows are overlapped. All arrows are parallel or perpendicular.

Graphics[{EdgeForm[Black], Opacity[0.3],  HarrissSpiralStep[{0, 0}, {A, B}, 0.7, True]}, 
     AspectRatio -> Automatic]

enter image description here

Attachments:
Reply to this discussion
Community posts can be styled and formatted using the Markdown syntax.
Reply Preview
Attachments
Remove
or Discard

Group Abstract Group Abstract