Hello everyone,
I'm working on a model in which a polymer is both bent and twisted. I want to visualize the results of my simulation using a tube plot:
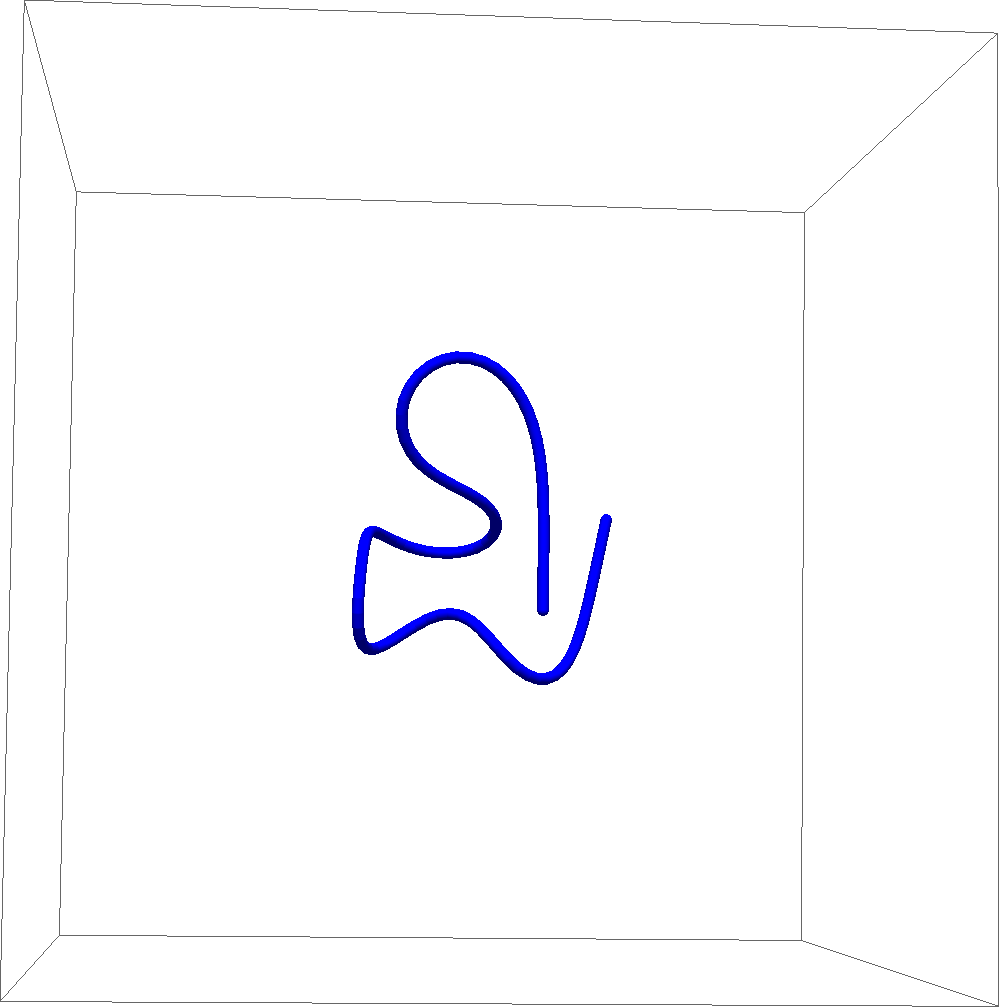
Manipulate[
 Graphics3D[Tube[solution[[t]]],
  PlotRange -> {{-1, 1}, {-1, 1}, {-1, 1}}, ImageSize -> 1000],
 {t, 1, Length[solution] - 1, 1}]
..where 'solution' is a list of points in R^3. My idea for visualization of the tube's twist density is to color the tube accordingly. So, given a scalar function on [0,1], I want to map its values to a color and paint the tube with it, meaning e.q. red means a high twist density.
(Alternatively, I could think of painting a grid on the tube which twists around the tangent direction, but I imagine this for more difficult.)
My problem is now that I have no idea how to paint the tube arbitrarily, since afaik 'VertexColor' allows only for linear interpolations between the tube's ends.
Thank you, Steffen


