Message Boards Message Boards

0
|
26087 Views
|
5 Replies
|
2 Total Likes
View groups...
Share
Share this post:

How to find maximum values in 3D plot?

Dear All,

May I ask you something? I plotted a runoff (q) probability in 3D. I am expecting that the obtained result will show the variation of q. Thus, may I know how to extract the values of q in the peak time, like in this case time to peak is around 39. Please refer to attach. for the illustration of my obtained figure plotted in 3D.

If I plot it by using 2D, I could obtained the maximum values for both, q and t, by using FindMaximum command. However, I am not sure how to obtain the maximum values for plotting in 3D. Please kindly let me know if you know how to do so. Thanks in advance for your kind help.

Best Regards, Intan

Attachments:
POSTED BY: INTAN SUPRABA
5 Replies

Dear Intan,

I guess that I would need more information, on what exactly the problem is. The figure in the attached pptx document does not help.

In Maximize or NMaximize tend to work in 3D example. Let's look at:

Plot3D[Cos[x^2 + y^2]*Exp[-0.3 (x^2 + y^2)], {x, -6, 6}, {y, -6, 6}, PlotRange -> All]
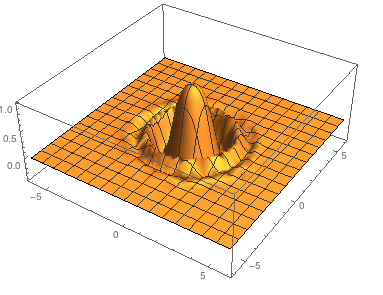
enter image description here

If you then simply use the Maximize function you get:

Maximize[{Cos[x^2 + y^2]*Exp[-0.3 (x^2 + y^2)] && -6 < x < 6 && -6 < y < 6}, {x, y}]
(*{1., {x -> -1.06836*10^-8, y -> -7.75192*10^-9}}*)

which says that the maximum value of 1 is reached at (numerically) {0,0}.

Cheers, Marco

POSTED BY: Marco Thiel

Dear Marco,

Thanks a lot for your reply. I am still not sure if Minimize command works for my case or not. If I am not wrong, for your example case, there is only 1 peak value which is 1 and it is occurred at x=0 and y=0. So what I would like to know, how if 1 plot consists of many peak values, like ensemble case, and I want to find out the maximum and the minimum values including the coordinate points of those max and min values. Thanks in advance for your help.

Best Regards, Intan

POSTED BY: INTAN SUPRABA

Maximize worked for me for a different function (using t, Q as example variables with example ranges)-

Maximize[{ Function [ ], 0<t<200 && 0<Q<1000}, {Q,t}]

POSTED BY: Laura McMullen

What was the function used to create the plot?

POSTED BY: Daniel Lichtblau
Posted 5 years ago

Hello Marco, I found your reply here really helpful for me. May I ask you a followup question? Is there any way to indicate in the diagram the level of x and y where the maximum is achieved, and also the maximum? Thanks! Best, Hyun Woong

POSTED BY: Ian P
Reply to this discussion
Community posts can be styled and formatted using the Markdown syntax.
Reply Preview
Attachments
Remove
or Discard

Group Abstract Group Abstract