Do you mean ternary plots like this?
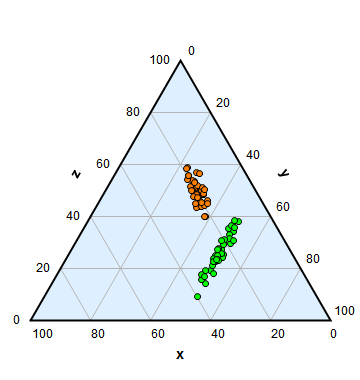
That was produced with the Ternary Plots graphics in my Presentations package, which can be purchased through my web site. The various commands are:
TernaryScale, ToTernaryCoordinates, FromTernaryCoordinates, TernaryReplacementRules, DrawTernaryGrid, TernaryTriangle, TernaryPlotRange, TernaryPadding, TernaryPlot, TernaryLocator, TernaryContourDraw, TernaryRegionDraw, TernaryDraw3D.
The actual code for the above plot was:
<< Presentations`
Module[
 {data1, data2, temp1, temp2},
 data1 = Table[{temp1 = RandomReal[NormalDistribution[20, 2]],
    temp2 = RandomReal[NormalDistribution[30, 4]],
    TernaryScale - temp1 - temp2}, {40}];
 data2 = Table[{temp1 = RandomReal[NormalDistribution[25, 8]],
    temp2 = RandomReal[NormalDistribution[50, 1]],
    TernaryScale - temp1 - temp2}, {40}];

 plot1 = TernaryPlot[
   DrawTernaryGrid[5,
    TGBackground -> LightBlue,
    TGLabels -> {1.4, {"x", "y", "z"}, "side"}],
   CirclePoint[ToTernaryCoordinates[#], 3, Black, Orange] & /@ data1,
   CirclePoint[ToTernaryCoordinates[#], 3, Black, Green] & /@ data2]
 ]


