Hi,
as I don't have your interpolated function I will have to make up my own. I generate data points:
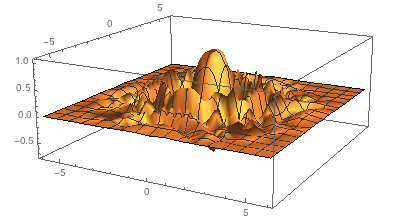
x = Flatten[Table[{x, y, Cos[x^2 + y^2]*Exp[-0.1 (x^2 + y^2)]}, {x, -6, 6, 0.5}, {y, -6, 6, 0.5}], 1];
and build my interpolation function:
f = Interpolation[x, InterpolationOrder -> 2]
which I then can plot
Plot3D[f[x, y], {x, -6, 6}, {y, -6, 6}, PlotRange -> All]
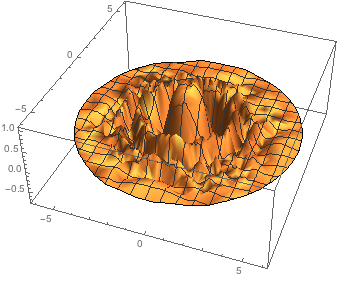
I can plot/consider this on a circular region only if I want:
Plot3D[f[x, y], {x, y} \[Element] Disk[{0, 0}, 6], PlotRange -> All]
I can then find the maximum:
NMaximize[{f[a, b]}, {a, b} \[Element] Disk[{0, 0}, 6], Method -> "DifferentialEvolution"]
(*{1.05071, {a -> 0.169378, b -> 0.169378}}*)
which is reasonable. Note that I needed to use a non-standard method for this; the standard method only found a local maximum.
Cheers,
Marco


