Recently Stephen Wolfram announced the Wolfram Data Drop, which is a great new tool to upload any type of data from any type of device. In this post, I will show how you can use the Data Drop when building your own weather station using some basic hardware and a few lines of code. Once completed, your device will take temperature measurements every second for 60 seconds, and upload their average value to the Wolfram DataDrop every minute. This will give you 60 data points per hour and 1,440 data points per day. With this data you can then use the Wolfram Programming Cloud to understand how the temperature changes over time: You can find out the exact times in a given day when the temperature was the highest or lowest, and when the temperature changed the fastest, and maybe even use the data to make predictions for the future! Can you beat your local weather station and make a prediction that is better?
How to build your weather station
For this experiment you will need an Arduino Yun (or an equivalent Arduino that has wireless capability), a TMP36 temperature sensor and a breadboard and jumper wires.
Here is the hardware diagram. Connect the 5V pin to the left pin of the TMP36 sensor, connect the GND pin to the right pin of the TMP36, and the A0 pin to the middle TMP36 pin.
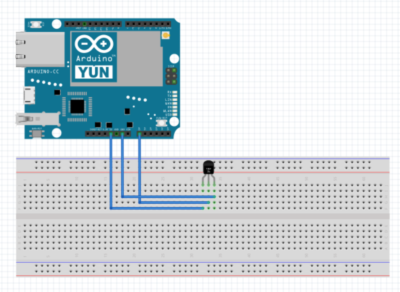
Once everything is connected and powered up, the TMP36 sensor will send a voltage to the A0 pin. This voltage increases when the temperature goes up and it decreases when the temperature goes down. So we can use the voltage reading and interpret it as a temperature. Luckily in this experiment we only needed three jumper cables, so hopefully you did not end up looking like this poor man:

Programming the Arduino
Now we are ready to write the Arduino code which is going to upload the recorded temperature data to the Wolfram Cloud. Make sure your Arduino Yun is configured to connect to the internet (http://arduino.cc/en/Guide/ArduinoYun#toc13). Then using the Arduino application, upload the following sketch onto your Arduino after you replace the text 'YOURBINID' with the 'Short ID' of a Databin that you created yourself:
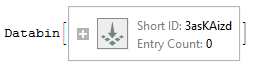
CreateDatabin[]
To follow along with the code, here is what it does: The process 'p' variable is used for calling a tool called 'curl' which is a way to make http requests with your Arduino. In our case we call a specific 'data drop' url, which lets you upload small bits of temperature data easily (https://datadrop.wolframcloud.com/api/v1.0/Add). In the loop() section of the code you can see how the variable 'val' is reading from the analog pin (A0) and how it is then converted from a raw reading to a 'temperature' variable. This temperature is then added to an 'average' variable exactly 60 times, but on the 60th time, the code will execute the block of the if statement. This code block runs the data upload code to upload the average of the 60 measurements and it also resets all the counters, so that everything will start over again. Finally, at the end, is a 1000 millisecond delay which will (approximately) space out your recorded temperatures by one second.
#include <Bridge.h>

Process p;
int val,count;
float voltage,temperature,average;

void setup() {
 count=0;
 average=0;
 Bridge.begin();
 Serial.begin(9600);
}

void loop() {
 val = analogRead(0);
 voltage = val * 5.0;
 voltage = voltage/1024.0;
 temperature = (voltage-0.5)*100;
 average += temperature;
 count++;
 if( count>59 ) {
  p.begin("/usr/bin/curl");
  p.addParameter("--insecure");
  p.addParameter("--location");
  p.addParameter("https://datadrop.wolframcloud.com/api/v1.0/Add?bin=YOUR_BIN_ID&temperature="+String(average/60));
  p.run();
  while(p.available()>0) {
   char c = p.read();
   Serial.print(c);
  }
  Serial.println();
  Serial.flush();
  count = 0;
  average = 0;
 }
 delay(1000);
}
To test that everything worked, you can open the Arduino serial monitor. If successful, you will see these messages like the one below appear every minute or so:
<|"Message" -> "The data was successfully added.",
"Bin" -> "DD7051e03ace9-a194-44c1-9864-8fcef8ea9af3",
"Data" -> <|"temperature" -> "34"|>,
"Timestamp" -> {2015, 2, 9, 16, 18, 39.99526`8.354583502904967},
"Information" -> {"EntryCount" -> 1, "LatestTimestamp" -> 3632487520, "Size" -> 288}|>
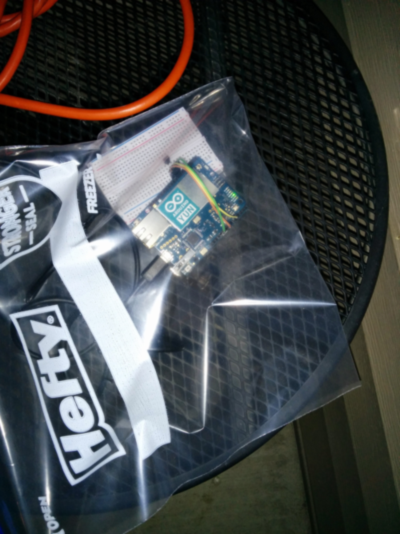
Now you can put your device in a weather resistant container (I used a Hefty bag) and place it outside in a location that is shaded for most of the day (like a porch):
Analysis of the temperature data
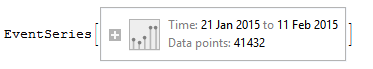
Now we're ready to do some interesting analysis of your temperature data! It's best to collect at least one full day of data before analyzing it, but the code below should work for shorter time periods as well. First we need to get the data from the databin we used to upload the temperature data. The arduino sketch uses 'temperature' as the url parameter for the temperature, so we will need to use the same thing here to retrieve it. In this example, my databin has collected data for about 20 days (for your experiment, replace the text 'YOURBINID' with the bin id shown in the output from CreateDatabin[] above):
bin = Databin["YOUR_BIN_ID"];
data = bin["Data"];
temperature = data["temperature"]
Now we will need to transform the temperature event series in a few more steps:
First, shift the series to account for the proper time zone (CST). This is done with the TimeSeriesShift command.
Next, calibrate the temperatures so they match more closely official NOAA measurements for a nearby official weather station. In my case I used official an NOAA weather station (KCMI) to calibrate my $2 TMP36 temperature sensor with the undoubtably much more expensive and precise offcial sensor data. Calibration is an important step and in this case I had to correct my data by about 5 degrees Celsius to match the official data. Another good way to calibrate your TMP36 sensor is to place it into a cup with ice water (exactly 0 degrees Celsius) and a cup with boiling water (exactly 100 degrees Celsius).
Next, define the time window of interest. In my case the starting point of reliable data was on DateObject[{2015,1,22,21,0,0}] (January 22 at 9PM). You will need to change this to a date which is a good starting point for your data.
Finally, resample the data to evenly spaced periods of 15 minutes. You will quickly notice that recording data every minute will give you a massive amount of data points and sampling it back to 15 minute intervals will still give you enough data to work with for plots that show multiple days of data.
Here is all the code we just discussed above:
temperature = EventSeries[Cases[First[temperature["Paths"]], {_Real, _Real}]];
temperature = TimeSeriesShift[temperature, Quantity[-6, "Hours"]];
temperature = TimeSeriesMap[# - 5 &, temperature];
temperature = TimeSeriesWindow[ temperature, {DateObject[{2015, 1, 22, 21, 0, 0}], Now}];
temperature = TimeSeriesResample[temperature, Quantity[0.25, "Hours"], ResamplingMethod -> {"Interpolation", InterpolationOrder -> 1}];
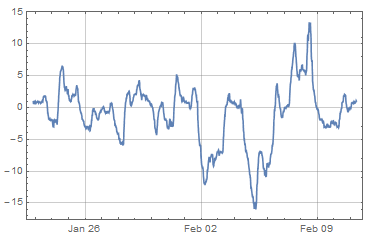
Now at this point you can do a quick check that your temperature data is looking OK:
DateListPlot[temperature, GridLines -> Automatic]
But we can make this a lot more useful and interesting. Let's write a function which will collect a specific point of interest for each day of data, for example the Min and Max of this data:
TimeSeriesFilter[series_, func_] := Module[{startdate, enddate, daterange},
  startdate = First[series["Dates"]] /. {DateObject[{y_, m_, d_}, TimeObject[{_, _, _}]] :> DateObject[{y, m, d}, TimeObject[{0, 0, 0}]]};
  enddate = Last[series[ "Dates"]] /. {DateObject[{y_, m_, d_}, TimeObject[{_, _, _}]] :> DateObject[{y, m, d}, TimeObject[{0, 0, 0}]]};
  daterange = DateRange[startdate, enddate, Quantity[1, "Days"]];
  EventSeries[
   Table[window =  TimeSeriesWindow[ series, {date, DatePlus[date, Quantity[1, "Days"]]}];
   path = window["Path"];
   First[Select[path, Last[#] == func[window] &]], {date, daterange}]
 ]
]
This function above simply generates a new EventSeries from the given one and collects the data points that satisfy a particular function for a given day.
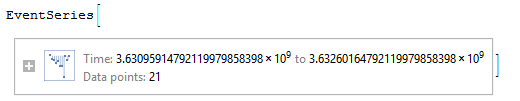
First let's create a new EventSeries which contains all the daily minimum temperatures:
minseries = TimeSeriesFilter[temperature, Min]
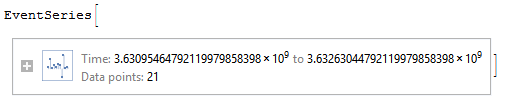
maxseries = TimeSeriesFilter[temperature, Max]
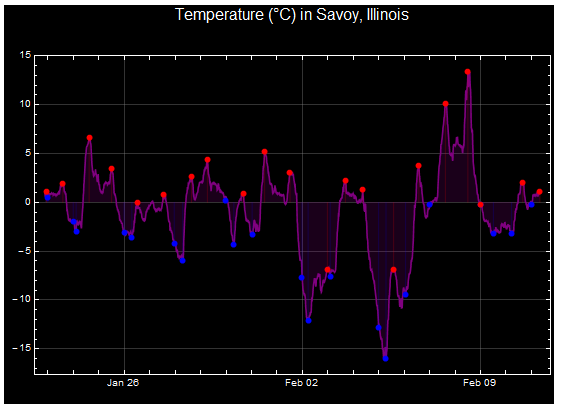
And now we can plot the temperature data (purple) with the daily minimum temperatures (blue dots) and maximum temperatures (red dots):
DateListPlot[{temperature, minseries, maxseries},
 GridLines -> Automatic, Filling -> Axis,
 PlotLabel -> Style["Temperature (\[Degree]C) in Savoy, Illinois", 16, FontColor -> White], ImageSize -> Large,
 Joined -> {True, False, False}, Background -> Black,
 FrameStyle -> White, ImagePadding -> 30,
 PlotStyle -> {Purple, {Blue, AbsolutePointSize[6]}, {Red, AbsolutePointSize[6]}}]
Conclusion
And that is it for this experiment! You now have a working weather station, and a dataset which is easy to analyze: By modifying the given code you can visualize daily averages or weekly or monthly averages. Or you can try to make predictions for tomorrow's weather based on patterns you have observed in the past (and perhaps combine this data with additional weather measurements like pressure and humidity data).


