Hi. The problem is:
1) I have this data
data = {{0., 0.}, {0.05, 0.4651}, {0.1, 0.6433}, {0.15, 0.7298}, {0.2,
     0.779}, {0.25, 0.81}, {0.3, 0.831}, {0.35, 0.8462}, {0.4,
    0.8576}, {0.45, 0.8664}, {0.5, 0.8736}, {0.55, 0.8796}, {0.6,
    0.8848}, {0.65, 0.8895}, {0.7, 0.8941}, {0.75, 0.8989}, {0.8,
    0.9045}, {0.85, 0.9118}, {0.9, 0.9231}, {0.95, 0.9445}, {1., 1.}};
2) Then I used this function to fit
lm = LinearModelFit[data, {1, x, x^2, x^3, x^4, x^5, x^6, x^7, x^8, x^9, x^10, x^11, x^12, x^13}, x];
3) Giving as result
Normal[lm]

4.52895*10^-7 + 15.253 x - 172.249 x^2 + 1400.18 x^3 - 8217.17 x^4 +
 34924. x^5 - 107986. x^6 + 243429. x^7 - 398598. x^8 + 467992. x^9 -
 383347. x^10 + 207813. x^11 - 66956.9 x^12 + 9703.78 x^13
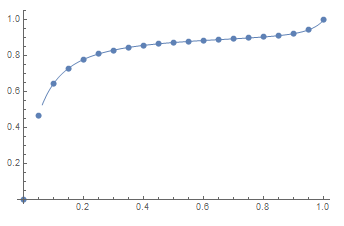
4) This plot showed correlation.

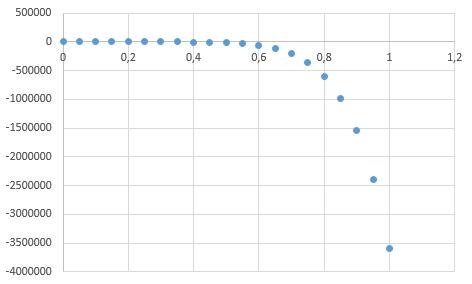
5) But when I use the aquation in Excel it is way far from describing data:

I wonder why. Please help.