Group Abstract Group Abstract

Message Boards Message Boards

Does LinearModelFit show the correct equation?

Posted 11 years ago

Hi. The problem is:

1) I have this data

data = {{0., 0.}, {0.05, 0.4651}, {0.1, 0.6433}, {0.15, 0.7298}, {0.2,
     0.779}, {0.25, 0.81}, {0.3, 0.831}, {0.35, 0.8462}, {0.4, 
    0.8576}, {0.45, 0.8664}, {0.5, 0.8736}, {0.55, 0.8796}, {0.6, 
    0.8848}, {0.65, 0.8895}, {0.7, 0.8941}, {0.75, 0.8989}, {0.8, 
    0.9045}, {0.85, 0.9118}, {0.9, 0.9231}, {0.95, 0.9445}, {1., 1.}};

2) Then I used this function to fit

lm = LinearModelFit[data, {1, x, x^2, x^3, x^4, x^5, x^6, x^7, x^8, x^9, x^10, x^11, x^12, x^13}, x];

3) Giving as result

Normal[lm]

4.52895*10^-7 + 15.253 x - 172.249 x^2 + 1400.18 x^3 - 8217.17 x^4 + 
 34924. x^5 - 107986. x^6 + 243429. x^7 - 398598. x^8 + 467992. x^9 - 
 383347. x^10 + 207813. x^11 - 66956.9 x^12 + 9703.78 x^13    

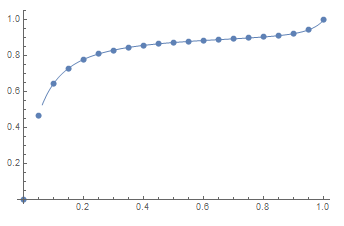
4) This plot showed correlation.

enter image description here

5) But when I use the aquation in Excel it is way far from describing data:

enter image description here

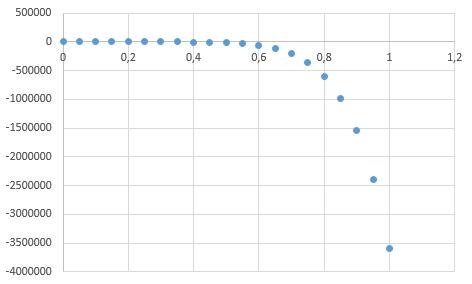
I wonder why. Please help.

POSTED BY: Juan David
6 Replies
Posted 11 years ago

If you the objective allows all calculations to be performed in Mathematica (rather than reproduced in Excel), then using the Interpolation function works great:

data = {{0., 0.}, {0.05, 0.4651}, {0.1, 0.6433}, {0.15, 0.7298}, {0.2,
     0.779}, {0.25, 0.81}, {0.3, 0.831}, {0.35, 0.8462}, {0.4, 
    0.8576}, {0.45, 0.8664}, {0.5, 0.8736}, {0.55, 0.8796}, {0.6, 
    0.8848}, {0.65, 0.8895}, {0.7, 0.8941}, {0.75, 0.8989}, {0.8, 
    0.9045}, {0.85, 0.9118}, {0.9, 0.9231}, {0.95, 0.9445}, {1., 1.}};
f = Interpolation[data]
Show[{ListPlot[data], Plot[f[x], {x, 0, 1}, PlotRange -> All]}]
f[0.756]

with output

Interpolation figure

But if you need the fitted equation outside of Mathematica (like in Excel), then determining how Mathematica deals with the interpolation object might be possible but I don't know if that's available. If providing predictions to others is the objective, does turning this into a CDF document achieve that?

POSTED BY: Jim Baldwin
Posted 11 years ago

Well, data is generated like Y=f(x,T) with a non-linear equation that models chemical equilibrium. Yes, i'm trying to aproximate with something faster and exclude T variable to solve equation easily. This is for designing a distillation column :). The design calculations are often realized graphically. I need something that fits data to interpolate, so if a polynomia fits it's ok for me, better than graphic "eye" method. Data could be experimental, it is similar to model. I think errors here are independent and identically distributed.

Thank you, Jim. You helped me a lot.

POSTED BY: Updating Name
Posted 11 years ago

Excellent about the use of StringReplace! I'm embarrassed to say that all these years I've been editing those output equations by hand. Thank you!

I wouldn't necessarily recommend polynomials at all. I should have asked initially how your data was generated. As a statistician, I'm always suspicious of data with such a smooth connected set of points. Is this one run of some experiment? Are the points generated by a much more complex formula and you're trying to approximate that with something that faster to run? Is the process that generates the data inducing a serial correlation? In other words, what is the data generation process? (I ask because LinearModelFit as used assumes that the errors are independent and identically distributed - which is important if you want to make inferences about the parameters or predictions.)

POSTED BY: Jim Baldwin
Posted 11 years ago

Hi, Jim! Thank you for your reply. It was very useful.

At first I would like to recommend you this function in case you want to edit an expression in short time:

StringReplace[" 4.5289452342107005e-7 + 15.253009862753892*x - \ 172.24927366903987x2 + 1400.184945935208x**3 - \ 8217.174010285653x4 + 34923.988960709925x**5 - \ 107985.66964678626x6 + - 243429.0999193785x*7 - 398597.880639793x**8 + \ 467992.1952924235x9 - 383346.5309523954x**10 + \ 207812.90625504x11 - 66956.90230299356x**12 + \ 9703.778442430377x13", {"." -> ",", "x" -> "A2", "*" -> "^"}]

"\" at the end of rows has to be removed manually, they appear when you copy text to excel.

Also I would like to discuss about fitting data to polynomia. I assume you suggest an InterpolatingPolinomial. I did it and the results were good, but the expression does not fit well near edges.

enter image description here

¿So what is the correct thing?

Thank you again. Have a nice day.

Attachments:
POSTED BY: Juan David
Posted 11 years ago

Actually, if you use CForm rather than FortranForm, you'll have to do a lot less text editing to get the equation into Excel.

POSTED BY: Jim Baldwin
Posted 11 years ago
Attachments:
POSTED BY: Jim Baldwin
Reply to this discussion
Community posts can be styled and formatted using the Markdown syntax.
Reply Preview
Attachments
Remove
or Discard