My purpose here is to show a curious (to me at least) result that followed from browsing through the wealth of astronomical data that is available to anyone who has access to Mathematica. The naked eye stars seem like a good place for a beginner (such as myself) in astronomy to start. With the exception of the Sun, these stars are so far away that their postions appear to be fixed on a so-called "celestial sphere" of infinite radius centered on the Earth.
I have compiled a list of 8910 "naked eye stars" in order of decreasing brightness along with their positions on the celestial sphere.
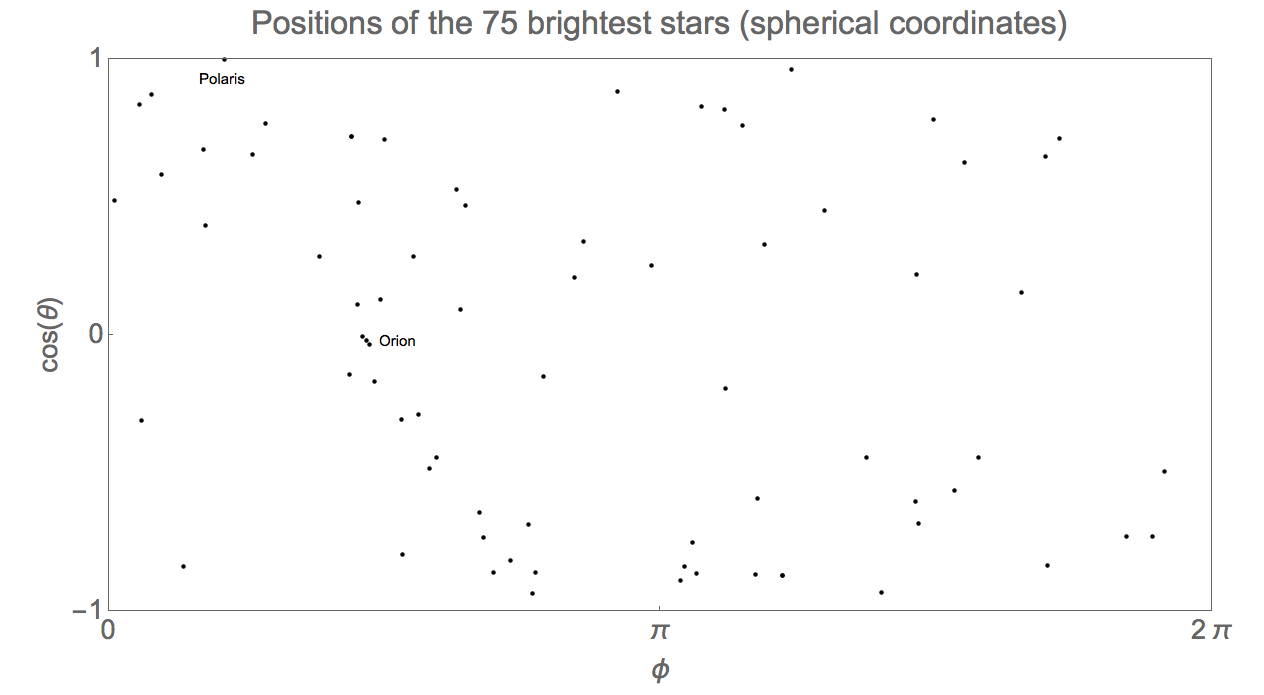
For purposes of orientation, here is a scatter plot of the 75 brightest stars, showing the obvious reference points of Polaris and Orion.

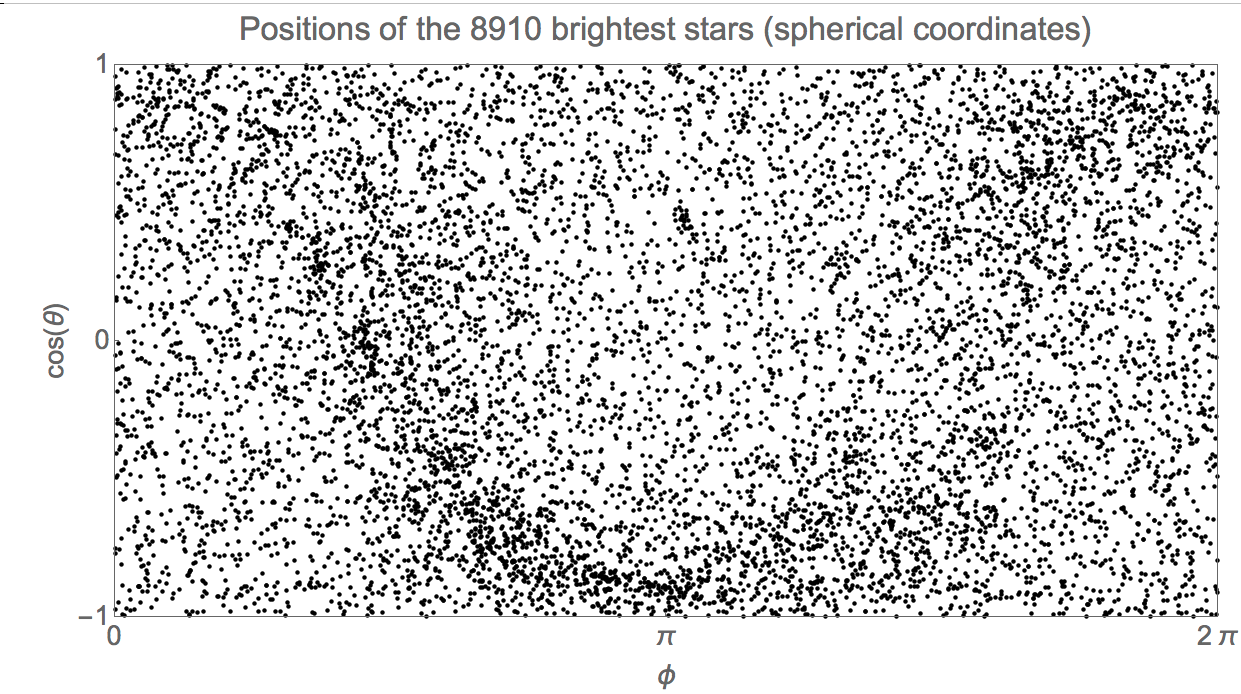
But what happens when all 8910 stars are included? My expectation was that these stars are sufficiently numerous while at the same time comprising such a tiny portion of the Milky Way that their distribution would more or less resemble a uniform probability density over the full 4 Pi steradian domain of the above plot.
I was therefore surprised to obtain

This is clearly not a uniform distribution. Could someone explain to me why this would be the expected result? If you chose an "average" point in interstellar space, how should one expect such a distribution to look?
Further investigation shows that this distribution is aligned with the plane of the Milky Way. More details are given in the attached file.
 Attachments: