Message Boards Message Boards

0
|
7794 Views
|
4 Replies
|
3 Total Likes
View groups...
Share
Share this post:

How to show/plot 3D spheres randomly?

Posted 10 years ago

Hello - newbie here; use very old Rev of Mathematica; am attempting to generate multiple random 3D spheres for molecular and/or astronomical simulations. I am familiar process for generating random "points", "lines", "polygons" and "cuboids". (see below - & attach)

rcoord := {Random[ ], Random[ ], Random[ ]}

Show[Graphics3D[ Table[Cuboid[10 rcoord], {18}] ]

However, am unfamiliar w/'commands'/methodology to produce 'spheres' of any given radius/color. I wud guess that I could use - " ParametricPlot3D[ {Cos[t]...[u]...Sin[t]...[u] ... " after the 'rcoord' input; or, possibly the " SphericalPlot3D[ r, {theta...}, {phi... ] ?? (I could probably have tried these above < time than this silly message !!!! )

Thx for any assistance.

Attachments:
4 Replies

Hi,

try

Graphics3D[Sphere[RandomReal[1, {10, 3}], 0.1]]

enter image description here

Cheers,

Marco

POSTED BY: Marco Thiel

Hi there,

yes, my Mathematica is indeed newer (10.1). There are other ways to achieve the same thing like this one:

ContourPlot3D[Evaluate[Table[(x - RandomReal[])^2 + (y - RandomReal[])^2 + (z - RandomReal[])^2 == 0.03, {i, 1, 5}]], {x, -0.5, 1.5}, {y, -0.5, 1.5}, {z, -0.5, 1.5}, PlotPoints -> 40]
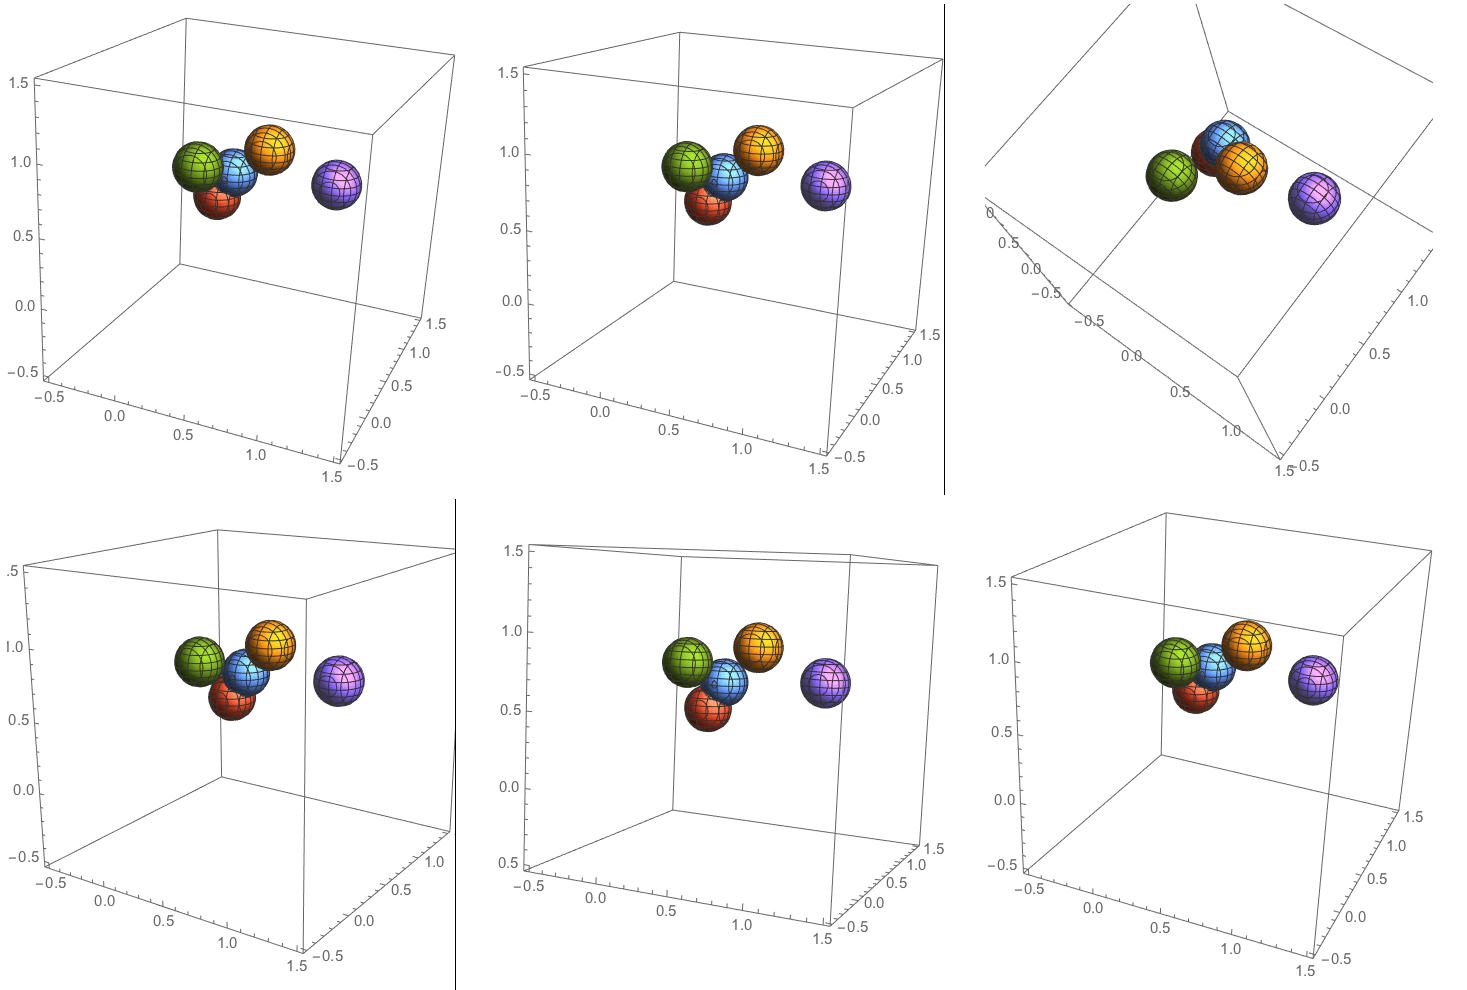
enter image description here

but also this one requires a much more recent Mathematica Version than the one you have. I would suggest to head to the Wolfram Programming Cloud website and make a free account. There you can get access to the most recent version of the Wolfram Language.

You can achieve something similar with Mathematica 2.2 though using ParametricPlot3D. I am not really sure about Mathematica 2.2 but I think that RandomReal[] did not work either. I think that Random did work. So you might want to try:

ParametricPlot3D[Evaluate[Table[a = Random[Real]; b = Random[Real]; 
c = Random[Real]; {r*Cos[(x)] Sin[y] + a, r*Sin[x] Sin[y] + b, r*Cos[y] + c} /. {r -> 0.1}, {i, 1, 5}]], {x, 0, 2 Pi}, {y, -Pi, Pi}, PlotPoints ->{40,40}]

It looks like this:
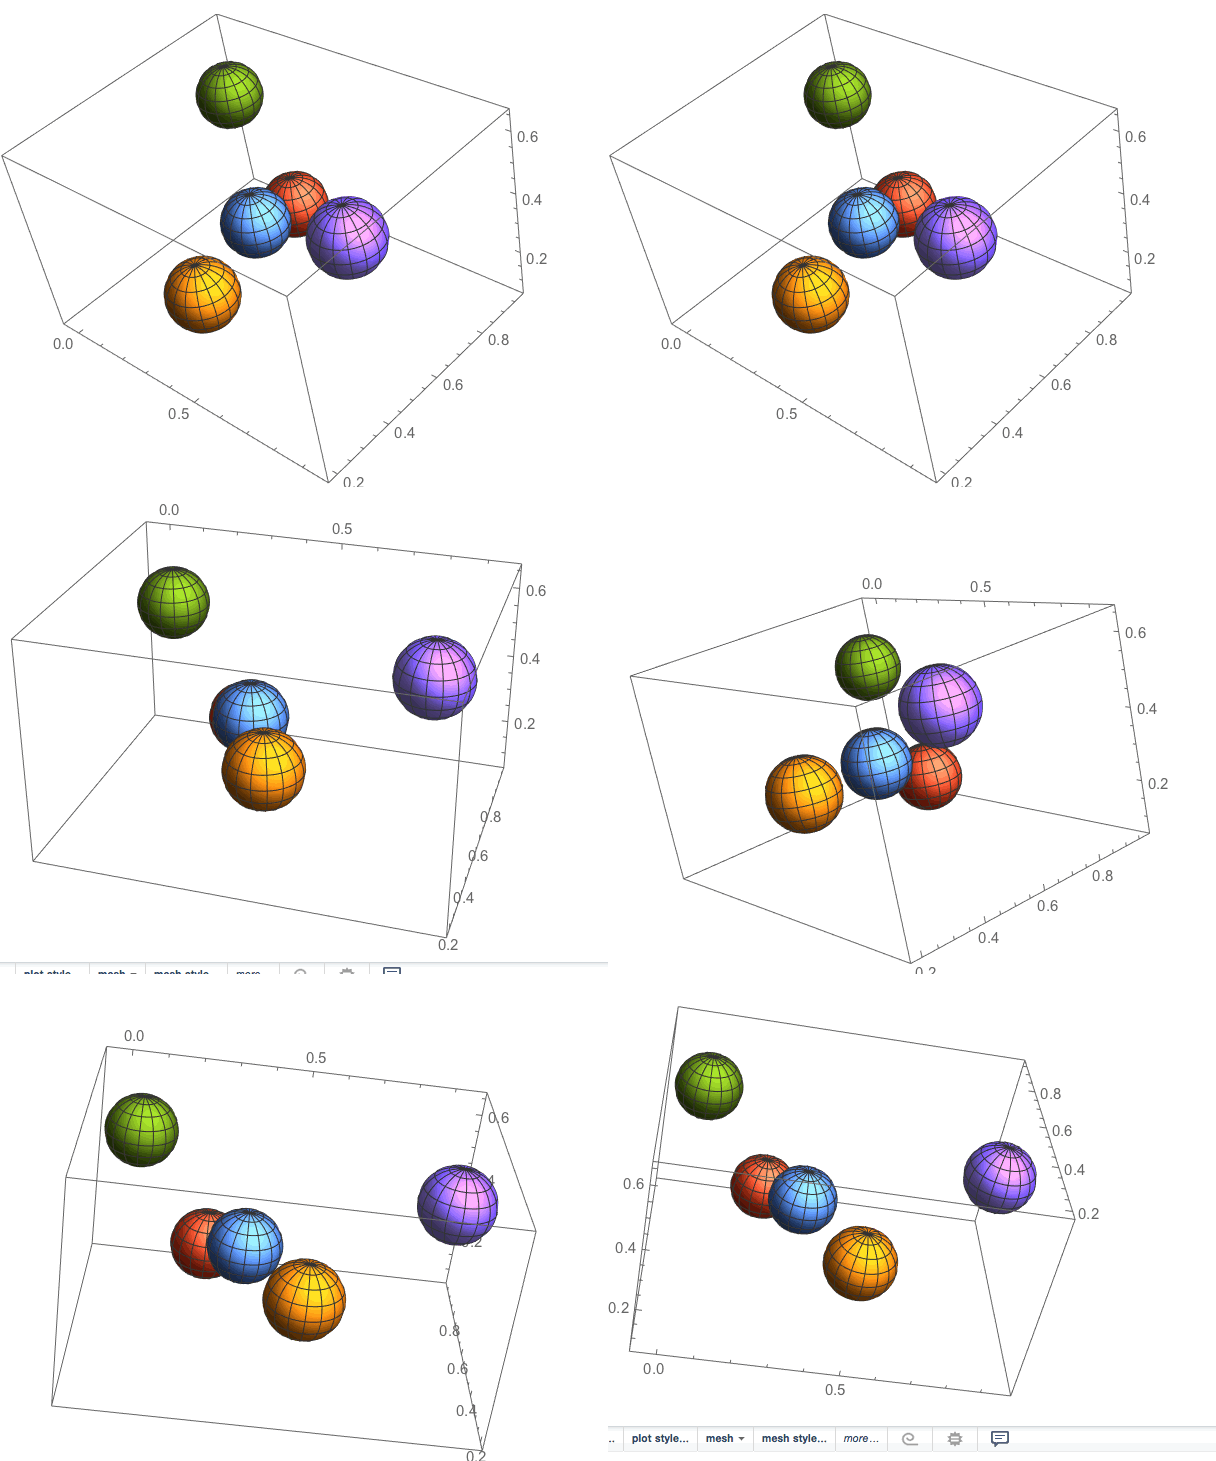
enter image description here

I do not have access to MMA2.2. Please let me know whether this works.

Cheers,

Marco

POSTED BY: Marco Thiel

Marco - Just logged on again; see ur rather sophisticated 'rendering' !! Thank u !!! I use Mathematica 2.2 & frankly haven't even looked up ur 'instruction set'/command. Not sure I even HAVE 'bouncing' ; however, will try later 2-nite. THX again !!! RPP

Hello again Marco -

Attempted ur code; got lotsa errors. Possibly YOUR Mathematica is new[er] & has additional subroutines/commands. I neglected to explain that I am running Rev 2.2 (student version when taking some additional grad courses) - see attached details of the Rev/Build # :

Also, although I don't believe it is really a factor, I am running several 'older versions' of Windows in Virtual Machines under Win7/Pro/64-bit. The Rev # under which I am running Math 2.2 is Win XP - see 2nd attach.

(also attached copy of the Mathematica notebook page showing my abominable attempts...) Sorry to bother. Thx again !!!

Attachments:
Reply to this discussion
Community posts can be styled and formatted using the Markdown syntax.
Reply Preview
Attachments
Remove
or Discard

Group Abstract Group Abstract