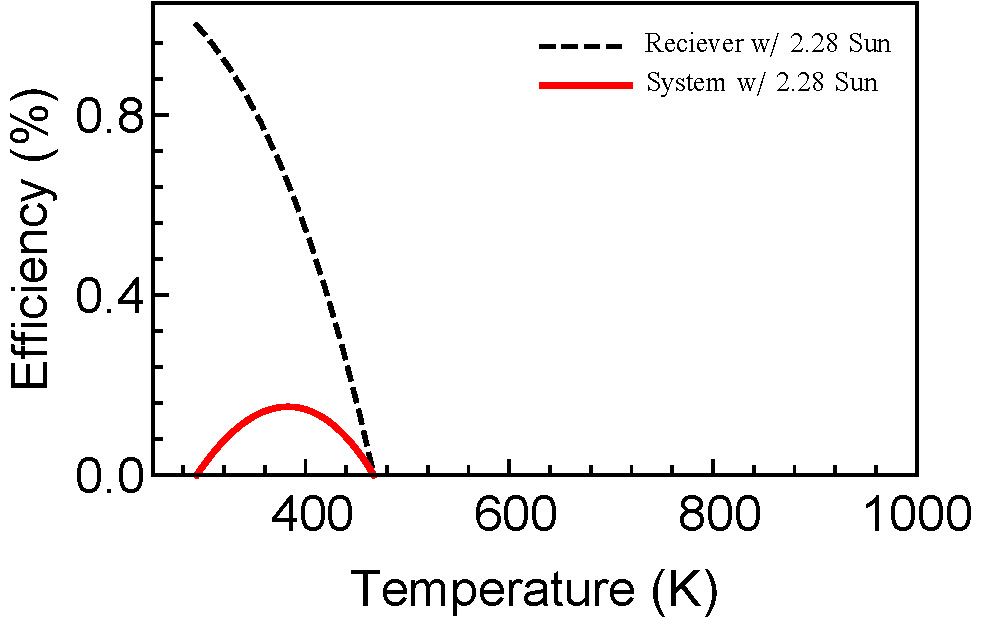
Hi,
It looks simple, but I'm been trying to solve this issue for days, but no luck yet. So, here I'm. I used "LinTicks", as customized option and another graphic option.
Here is my code. I'm always trying to make it simple, but this thing gets heavier with a graphic option (autoLegend). If you know better way, please, let me know. So, here is the code.
ClearAll["Global`*"]
Options[legendMaker] =
  Join[FilterRules[Options[Framed],
    Except[{ImageSize, FrameStyle, Background, RoundingRadius,
      ImageMargins}]], {FrameStyle -> None,
    Background -> Directive[Opacity[.7], LightGray],
    RoundingRadius -> 10, ImageMargins -> 0, PlotStyle -> Automatic,
    PlotMarkers -> None, "LegendLineWidth" -> 35,
    "LegendLineAspectRatio" -> .3, "LegendMarkerSize" -> 8,
    "LegendGridOptions" -> {Alignment -> Left, Spacings -> {.4, .1}}}];


legendMaker::usage =
  "Create a Graphics object with legends given by the list passed as \
the first argument. The options specify any non-deafult line styles \
(using PlotStyle -> {...}) or plot markers (using PlotMarkers -> \
{...}). For more options, inspect Options[legendMaker]";

legendMaker[textLabels_, opts : OptionsPattern[]] :=
  Module[{f, lineDirectives, markerSymbols, n = Length[textLabels],
    x}, lineDirectives = ((PlotStyle /. {opts}) /.
       PlotStyle | Automatic :> Map[ColorData[1], Range[n]]) /.
     None -> {None};
   markerSymbols =
    Replace[((PlotMarkers /. {opts}) /.
         Automatic :> (Drop[
              Normal[ListPlot[Transpose[{Range[3]}],
                  PlotMarkers -> Automatic][[1, 2]]][[1]], -1] /.
             Inset[x_, i__] :> x)[[All, -1]]) /. {Graphics[gr__],
         sc_} :> Graphics[gr,
         ImageSize -> ("LegendMarkerSize" /. {opts} /.
             Options[legendMaker,
              "LegendMarkerSize"] /. {"LegendMarkerSize" -> 8})],
      PlotMarkers | None :>
       Map[Style["", Opacity[0]] &, textLabels]] /.
     None | {} -> Style["", Opacity[0]];
   lineDirectives = PadRight[lineDirectives, n, lineDirectives];
   markerSymbols = PadRight[markerSymbols, n, markerSymbols];
   f = Grid[
     MapThread[{Graphics[{#1 /. None -> {},
          If[#1 === {None} || (PlotStyle /. {opts}) === None, {},
           Line[{{-.1, 0}, {.1, 0}}]],
          Inset[#2, {0, 0}, Background -> None]},
         AspectRatio -> ("LegendLineAspectRatio" /. {opts} /.
             Options[legendMaker,

              "LegendLineAspectRatio"] /. {"LegendLineAspectRatio" -> \
.2}), ImageSize -> ("LegendLineWidth" /. {opts} /.
             Options[legendMaker,
              "LegendLineWidth"] /. {"LegendLineWidth" -> 35}),
         ImagePadding -> {{1, 1}, {0, 0}}],
        Text[#3, FormatType -> TraditionalForm]} &, {lineDirectives,
       markerSymbols, textLabels}],
     Sequence@
      Evaluate[("LegendGridOptions" /. {opts} /.
          Options[legendMaker,
           "LegendGridOptions"] /. {"LegendGridOptions" -> {Alignment \
-> Left, Spacings -> {.4, .1}}})]];
   Framed[f,
    FilterRules[{Sequence[opts, Options[legendMaker]]},
     FilterRules[Options[Framed], Except[ImageSize]]]]];

extractStyles::usage =
  "returns a tuple {\"all line style directives\", \"all plot markers\
\"} found in the plot, in the order they are drawn. The two sublists \
need not have the same length if some lines don't use markers ";
extractStyles[plot_] :=
 Module[{lines, markers, points,
   extract = First[Normal[plot]]},(*In a plot,
  the list of lines contains no insets,so I use this to find it:*)
  lines = Select[Cases[Normal[plot], {___, _Line, ___}, Infinity],
    FreeQ[#1, Inset] &];
  points =
   Select[Cases[Normal[plot], {___, _Point, ___}, Infinity],
    FreeQ[#1, Inset] &];
  (*Most plot markers are inside Inset,
  except for Point in list plots:*)
  markers = Select[extract, ! FreeQ[#1, Inset] &];
  (*The function returns a list of lists:*){(*The first return value \
is the list of line plot styles:*)
   Replace[Cases[
     lines, {c__, Line[__], ___} :>
      Flatten[Directive @@ Cases[{c}, Except[_Line]]],
     Infinity], {} -> None],(*Second return value:marker symbols*)
   Replace[Join[
     Cases[markers, {c__, Inset[s_, pos_, d___], e___} :>
       If[(*markers "s" can be strings or graphics*)
        Head[s] ===
         Graphics,(*Append scale factor in case it's needed later;
        default 0.01*){s, Last[{.01, d}] /. Scaled[f_] :> First[f]},
        If[(*For strings,
         add line color if no color specified via text styles:*)
         FreeQ[s, CMYKColor | RGBColor | GrayLevel | Hue],
         Style[s, c], s]], Infinity],(*Filter out Pointsize-
     legends don't need it:*)
     Cases[points, {c___,
        Point[pt__], ___} :> {Graphics[{c, Point[{0, 0}]}] /.
         PointSize[_] :> PointSize[1], .01}, Infinity]], {} -> None]}]

autoLegend::usage =
  "Simplified legending for the plot passed as first argument, with \
legends given as second argument. Use the option Alignment -> \
{horizontal, vertical} to place the legend in the PlotRegion in \
scaled coordinates. For other options, see Options[legendMaker] which \
are used by autoLegend.";
Options[autoLegend] =
  Join[{Alignment -> {Right, Top}, Background -> White,
    AspectRatio -> Automatic},
   FilterRules[Options[legendMaker],
    Except[Alignment | Background | AspectRatio]]];
autoLegend[plot_Graphics, labels_, opts : OptionsPattern[]] :=
 Module[{lines, markers,
   align = OptionValue[Alignment]}, {lines, markers} =
   extractStyles[plot];
  Graphics[{Inset[plot, {-1, -1}, {Left, Bottom}, Scaled[1]],
    Inset[legendMaker[labels, PlotStyle -> lines,
      PlotMarkers -> markers,
      Sequence @@
       FilterRules[{opts},
        FilterRules[Options[legendMaker], Except[Alignment]]]], align,
      Map[If[NumericQ[#], Center, #] &, align]]},
   PlotRange -> {{-1, 1}, {-1, 1}},
   AspectRatio -> (OptionValue[AspectRatio] /.
       Automatic :> (AspectRatio /. Options[plot, AspectRatio]) /.
      Automatic :> (AspectRatio /.
         AbsoluteOptions[plot, AspectRatio]))]]

SetOptions[LinTicks, MajorTickLength -> {0.02, 0},
  MinorTickLength -> {0.013, 0}];

\[Sigma] = 5.67*^-8;(*Stefan-Boltzmann Constant*)
\[Epsilon] = 1;(*Emissivity*)
\[Alpha] = 1;(*Absorbtivity*)
\[Tau] = 1;(*Transmittance*)
g = 1*^3;(*Solar radiation 1Kw/m^2" *)
c = 2.28;(*Concentration*)
receff[x_] := \[Alpha] \[Tau] - (\[Sigma] \[Epsilon] (x^4 -
      293.15^4))/(c g);
syseff[x_] := (\[Alpha] \[Tau] - (\[Sigma] \[Epsilon] (x^4 -
        293.15^4))/(c g)) (1 - 293.15/x);
without =
  Plot[Evaluate[{receff[x], syseff[x]}], {x, 293.15, 1073.15},
   PlotStyle -> (Directive @@@
      Transpose[{Join[ConstantArray[Dashed, 1],
         ConstantArray[Thick, 1]],
        Flatten[ConstantArray[{Black, Red}, 1]]}]), Frame -> True,
   PlotRange -> {{250, 1000}, {0, 1.05}},
   FrameLabel -> {"Temperature (K)", "Efficiency (%)"},
   FrameStyle -> Directive[Black, 18],
   FrameTicks -> {LinTicks[0, 1100, 200, 5], LinTicks[0, 1, 0.4, 5],
     None, None}, ImageSize -> Large];

autoLegend[
 Show[without], {"Reciever w/ 2.28 Sun", "System w/ 2.28 Sun"},
 Background -> Directive[None, Opacity[.5]], Alignment -> {0.43, 0.8}]
Here is the result.

I was able to make big text for Ticks, but I couldn't get Legend big. If you know how to make it big, please, help me. It would be very appreciable. Thank you.