Message Boards Message Boards

0
|
4694 Views
|
2 Replies
|
0 Total Likes
View groups...
Share
Share this post:
GROUPS:

Eval/Plot a function which has a variable defined as a solution of an ODE

Posted 9 years ago

Hello,

I can obtain ?[t] as a solution of an ODE and plot it thanks to the following code

s = NDSolve[{eqL?, ?[0] == .79, ?'[0] ==  0}, ?, {t, 0, 2}] 
Plot[Evaluate[?[t] /. s], {t, 0, 2}, PlotRange -> All]

I would like to obtain the plot of x[t] which is a coordinate depending of ?[t]

x[t] = 1/2 (2 r Cos[?[t]] + Sqrt[2] Sqrt[2 l^2 - r^2 + r^2 Cos[2 ?[t]]])

May you help me to define the appropriated code so as to plot x[t] ?

Thanks a lot for your help.

POSTED BY: B B
2 Replies
Posted 9 years ago

Thank you You perfectly answer to my question.

POSTED BY: B B

Hi there,

it would have helped to have the actual ODE, but I will for this illustration just make one up:

eqL\[Gamma] = \[Gamma]''[t] - \[Gamma]'[t] - \[Gamma][t] == Sin[t];

You can then run your NDSolve

s = NDSolve[{eqL\[Gamma], \[Gamma][0] == .79, \[Gamma]'[0] == 0}, \[Gamma][t], {t, 0, 2}]

Then you can define the x[t]; note that you need to add values for $l$ and $r$ unless you want to use Manipulate or Animate.

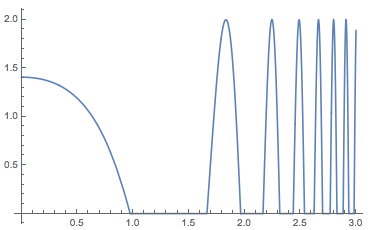
x = 1/2 (2 r Cos[\[Gamma][t]] + Sqrt[2] Sqrt[2 l^2 - r^2 + r^2 Cos[2 \[Gamma][t]]]) /. {s[[1, 1]], r -> 1, l -> 1}

and plot

Plot[x, {t, 0, 3}]

enter image description here

Cheers,

M.

POSTED BY: Marco Thiel
Reply to this discussion
Community posts can be styled and formatted using the Markdown syntax.
Reply Preview
Attachments
Remove
or Discard

Group Abstract Group Abstract