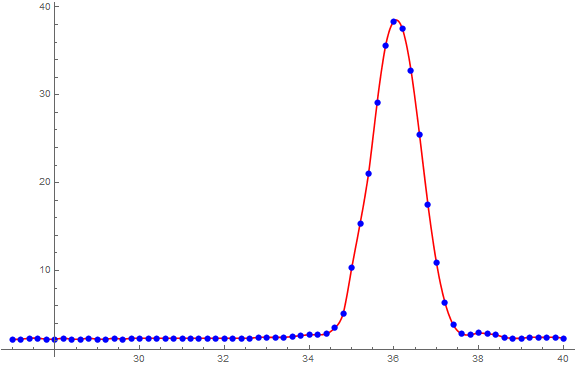
NonlinearModelFit is probably working just fine. It's your model using a sine wave that's the problem. While the points show a definite peak that isn't the shape of a sine wave (which has a peak and a trough and repeats) although if you restricted your fit of a sine to about 35 to 37, you might do better.
If you're mainly interested in approximating the curve (in Mathematica and not outside of Mathematica), then I recommend using the Interpolation function:
data = {{27, 2.2}, {27.2, 2.2}, {27.4, 2.3}, {27.6, 2.3}, {27.8, 2.2}, {28, 2.2}, {28.2, 2.3}, {28.4, 2.2}, {28.6, 2.2},
   {28.8, 2.3}, {29, 2.2}, {29.2, 2.2}, {29.4, 2.3}, {29.6, 2.2}, {29.8, 2.3}, {30, 2.3}, {30.2, 2.3}, {30.4, 2.3},
   {30.6, 2.3}, {30.8, 2.3}, {31, 2.3}, {31.2, 2.3}, {31.4, 2.3}, {31.6, 2.3}, {31.8, 2.3}, {32, 2.3}, {32.2, 2.3}, {32.4, 2.3},
   {32.6, 2.3}, {32.8, 2.4}, {33, 2.4}, {33.2, 2.4}, {33.4, 2.4}, {33.6, 2.5}, {33.8, 2.6}, {34, 2.7}, {34.2, 2.7}, {34.4, 2.8},
   {34.6, 3.5}, {34.8, 5.1}, {35, 10.3}, {35.2, 15.4}, {35.4, 21.1}, {35.6, 29.1}, {35.8, 35.6}, {36, 38.4}, {36.2, 37.5},
   {36.4, 32.8}, {36.6, 25.5}, {36.8, 17.5}, {37, 10.9}, {37.2, 6.4}, {37.4, 3.8}, {37.6, 2.8}, {37.8, 2.7}, {38, 2.9},
   {38.2, 2.8}, {38.4, 2.7}, {38.6, 2.4}, {38.8, 2.3}, {39, 2.3}, {39.2, 2.4}, {39.4, 2.4}, {39.6, 2.4}, {39.8, 2.4}, {40, 2.3}};
f = Interpolation[data];
Plot[f[x], {x, 27, 40}, PlotStyle -> Red, PlotRange -> Full];pPoints = ListPlot[data, PlotRange -> Full, PlotStyle -> Blue];
Show[{pInterpolation, pPoints}]

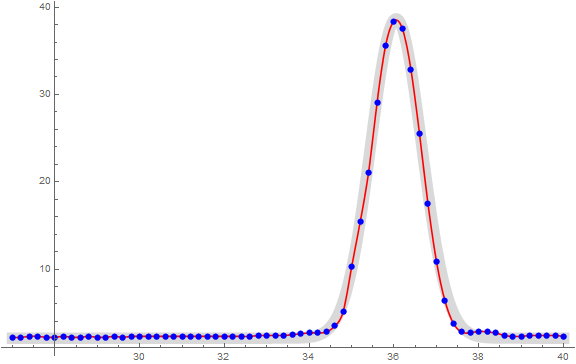
But if you need a curve form with parameters to estimate so that you can use the predictions outside of Mathematica (and for which you can decide visually if the fit is good enough), then you might want to try something like
pNormalCurve =
  Plot[2.1 + 55 PDF[NormalDistribution[36.05, 0.6], x], {x, 27, 40},
   PlotRange -> Full, PlotStyle -> {Thickness[0.02], LightGray}];
Show[{pNormalCurve, pInterpolation, pPoints}, ImageSize -> Large]

where the thick gray line is the normal curve fit. (I just did this by eye but you can use NonlinearModelFit also.)
If you need so say something about the parameters (i.e., measures of precision) and/or prediction errors, then something appropriate (in my opinion) depends on how the data is generated, if there will be multiple data sets which a need to compare parameters, how the residuals look, etc.