Message Boards Message Boards

0
|
3390 Views
|
2 Replies
|
0 Total Likes
View groups...
Share
Share this post:
GROUPS:

Why does the plot function not work the way I anticipated?

Hi dear participants,

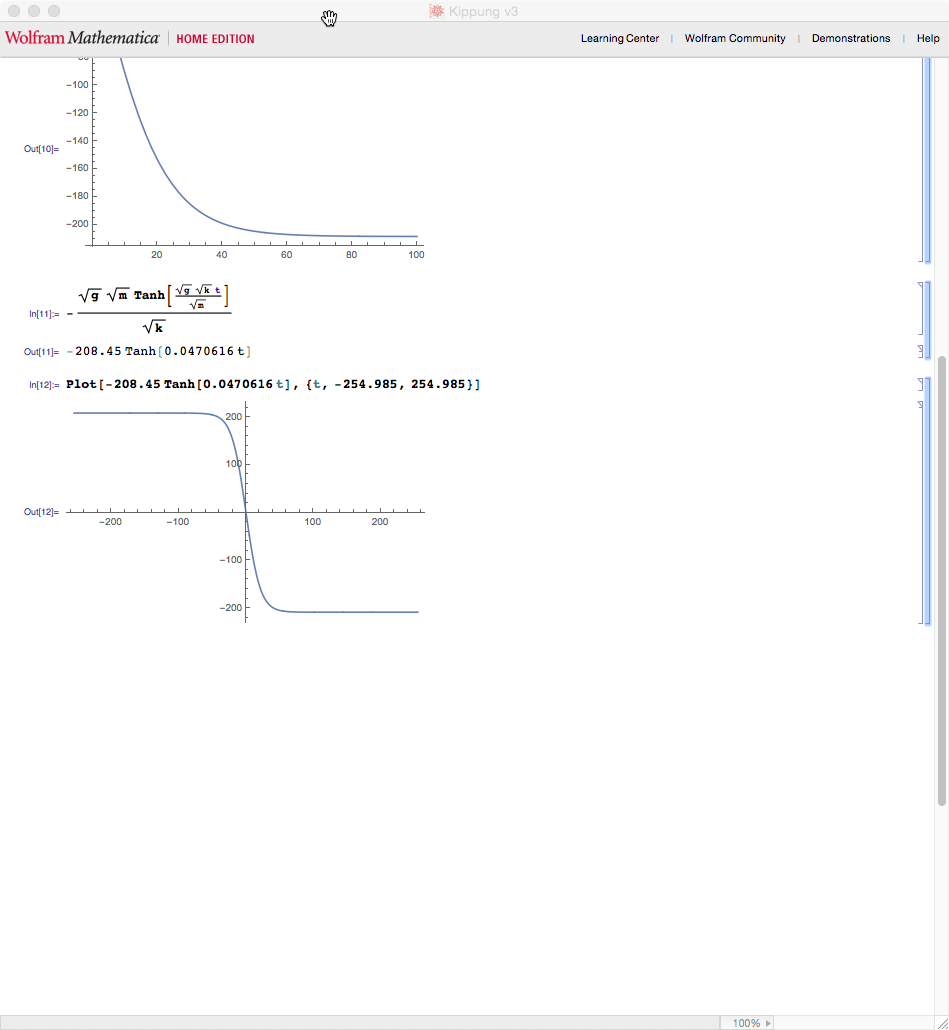
as a newbie I've a question with my notebook: enter image description here
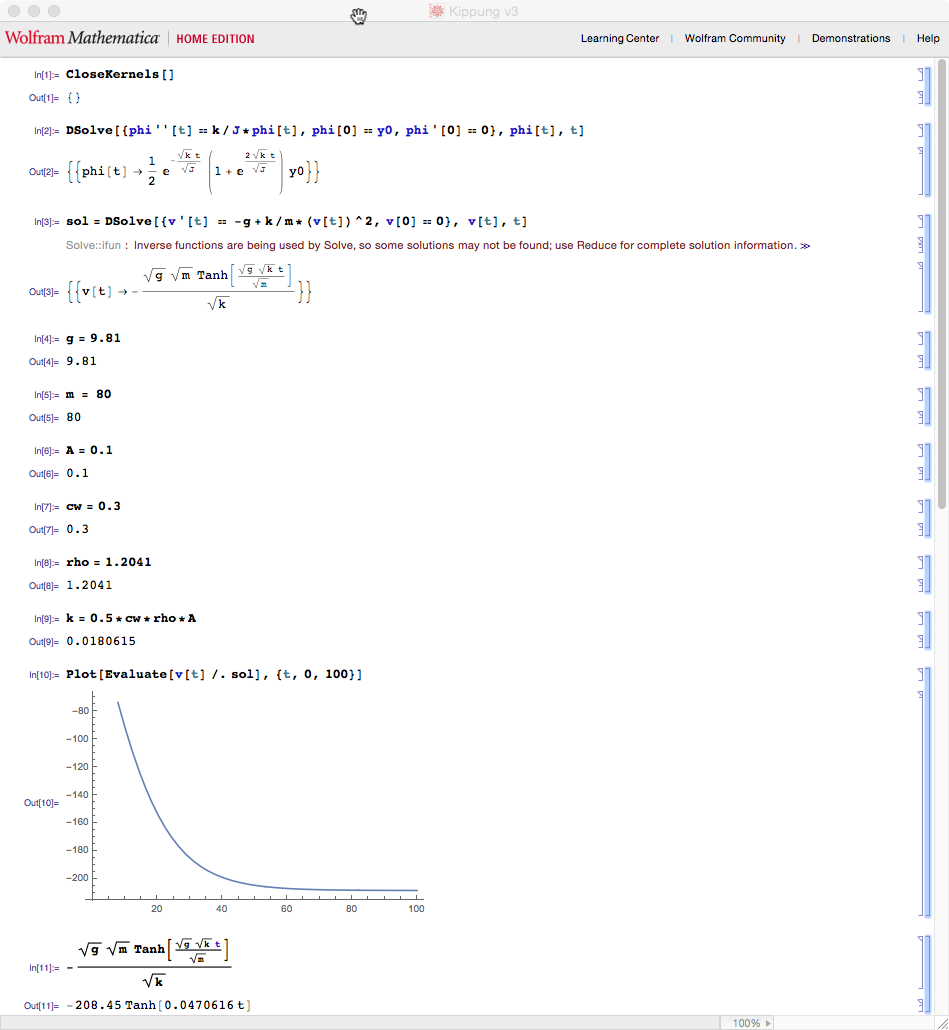
enter image description here

From the second differentiall (In[3] statement) equation I'd like to plot the solution of it into a graph (In[10] statement). For some reason this doesn't work. If I extract the solution and enter it as Out[11], then the plot works fine and it yields my result (Out[12] statement). What went wrong?

Your help is greatly appreciated! Best Regards, Ralf

POSTED BY: Ralf Matz
2 Replies

Hi Ralf,

check the plot range. In one case you plot from 0 to 100 and in the other from -255 to +255.

Cheers,

Marco

POSTED BY: Marco Thiel

Hi Marco,

I see. That did the trick! Thank you!

Cheers, Ralf

POSTED BY: Ralf Matz
Reply to this discussion
Community posts can be styled and formatted using the Markdown syntax.
Reply Preview
Attachments
Remove
or Discard

Group Abstract Group Abstract