Message Boards Message Boards

5
|
13230 Views
|
3 Replies
|
13 Total Likes
View groups...
Share
Share this post:

Mystery Aristotle peaks in noisy Wikipedia data

Posted 11 years ago
I have noticed that Wikipedia popularity data from Wolfra|Alpha can give some very curios cases. For example, this is a query for Aristotle:


To get these data into Mathematica we could just use:
data = WolframAlpha["Aristotle", {{"PopularityPod:WikipediaStatsData", 1}, "ComputableData"}];
DateListPlot[data, Joined -> True, AspectRatio -> 1/6]
We can obviously see sharp deeps or "negative" peaks at the end of every year and some wider deeps in the vicinity of August. My guess is winter and summer school vacations lead to the drop of student queries on Aristotle. This means that major source of those queries is from academia. Could this be true? Also notice how similar are the data for 2008 and 2009 - another argument towards some rather systematic data access through the year. But I would be really curious to find out what are those strong peaks in 2011 and 2012 landing in the same month approximately. Will we get the same peak in 2013?

To start thinking about these questions it would be helpful to be able to locate peak positions in the data - basically determine their time stamp. Any ideas on an efficient implementation?

But most importantly, where those peaks are coming from? Especially in the light that compared, for example, to Plato, - the totality of data are strongly correlated, confirming the academia hit source idea. But those peaks are definitely of charts.


POSTED BY: Vitaliy Kaurov
3 Replies
This is a very nice approach! Ok, so you are interested in just that two peaks. Well, i do not have a clue, why this happend, but if you analyse the data low peaks, you see that school holiday does effect that data most probably:


If you assume that july/august school is closed, you see, that nobody is interested in old greek guy's while taking time off. But right after that time, you see a almost stable level between 8-10 thousend requests that stops at xmas. The first half of the year you get a slighly falling interes in Aristoteles and it looks almost the same for every year. So the two peaks are really extraordinary events. What does the press archives say to that dates?
POSTED BY: Joerg Schoenau
Joerg, thank you for posting this. Though it is a neat pattern-based approach, I should notice that finding all maxima can be done with built in function MaxDetect. I was looking for something else - resolving in time two highest strange peaks - basically putting time stamp on them so we could start searching for a reasonable explanations of why did they happen. Now, having been armed with community-derived function for finding peaks, we can finally found out when did the spikes happen. Just in case, I repeat here the definition of the function:
 FindPeaks =
   Compile[{{data, _Real,
      1}, {width, _Integer}, {cut, _Real}}, (Table[0, {width}]~Join~
       UnitStep[
        Take[data, {1 + width, -1 -
               width}] - (Module[{tot = Total[#1[[1 ;; #2 - 1]]],
                last = 0.}, Table[tot = tot + #1[[j + #2]] - last;
                last = #1[[j + 1]];
                tot, {j, 0, Length[#1] - #2}]]/#2) &[data,
         1 + 2 width] - cut]~Join~Table[0, {width}]) ({0}~Join~
      Table[If[
        Sign[{data[[ii + 1]] - data[[ii]],
           data[[ii + 2]] - data[[ii + 1]]}] == {1, -1}, 1, 0], {ii,
        1, Length[data] - 2}]~Join~{0}), CompilationTarget -> "C"];
Now let's get the data:
raw = WolframAlpha["Aristotle", {{"PopularityPod:WikipediaStatsData", 1}, "TimeSeriesData"}];
data = raw[[All, 2]][[All, 1]];
and with a bit convoluted code I will place time stamps on strange peaks:
Show[DateListPlot[raw, Joined -> True, AspectRatio -> 1/6, ImageSize -> 800, Filling -> Bottom,
    Ticks -> {{#, Rotate[DateString[#, {"MonthNameShort", " ", "Year"}], Pi/2]} & /@ #[[All, 1]], Automatic},
    Frame -> False, Mesh -> All, PlotRange -> All], DateListPlot[If[# == {}, raw[[1 ;; 2]], #, #] &[#],
    AspectRatio -> 1/6, ImageSize -> 800, PlotStyle -> Directive[Red, PointSize[.007]], PlotRange -> All],
   PlotRangePadding -> {0, Automatic}] &[Pick[raw, FindPeaks[data, 1, 2 StandardDeviation[data]], 1]]


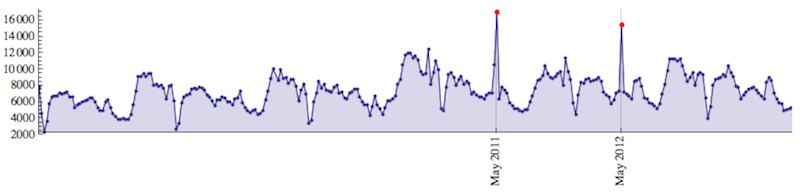
And voila! - they both land on May . Maybe in some schools students got an assignment to write a term paper on Aristotle or maybe a textbook was published with some homework on Aristotle. All that could be required to be hand in at the end of semester. Or anything similar. The most suspicious thing is why didn't it happen in previous or the next 2013 year? Well a lot of ground for speculations.

What are your thoughts? What could be a possible root to solving this mystery?
POSTED BY: Vitaliy Kaurov
What about this idea?
windowwidth = 4;
constraintwidth = 2;
lowerthreshold = 10;
maxima = {False};
testdata = QuantityMagnitude[Last[Transpose[data]]];
Define some test - patterns, that identify peaks
 tests = Table[
   dat = Drop[testdata, ii];
   Map[{#, ii} &,
    Partition[Sign[dat - RotateLeft[dat]], windowwidth,
     windowwidth/2]],
   {ii, 1, windowwidth - 1}
   ];
pos = Position[ tests, {{__, -1, 1, __}, offset_}, Infinity  ];
Get peak positions:
hits = Union[Round[Last[#]*(windowwidth/2) + 1 + First[#]] & /@ pos];
maxima = First /@ Tally[hits, Abs[#1 - #2] < windowwidth/2 &]
Plot
 Show[
 DateListPlot[data, Joined -> True, AspectRatio -> 1/6],
 DateListPlot[Map[
   data[[#]] &, maxima], PlotStyle -> Red]
 ]

POSTED BY: Joerg Schoenau
Reply to this discussion
Community posts can be styled and formatted using the Markdown syntax.
Reply Preview
Attachments
Remove
or Discard

Group Abstract Group Abstract