Message Boards Message Boards

0
|
4539 Views
|
2 Replies
|
1 Total Likes
View groups...
Share
Share this post:

swing of the pendulum

Posted 10 years ago

I would like to visualize a swing of the pendulum. I want to write a function springmass[z, nzigzag], which will draw the spring (line) and the swinging weight (rectangle) for an default total length z and a quantity of spring coils (nzigzag).

I should animate the motion with exactly this line:

Animate[Graphics[springmass[5 + Sin[?], 23],PlotRange -> {-9, 0}], {?, 0, 2 ?}]

That's what I found on the internet:

With[{min = .4}, 
  vspring[a0_, y10_, y20_] := 
    Module[{a = a0, y1 = y10 + min, y2 = y20, n = 100}, 
      h = (y2 - y1)/n; 
      yvalues = Table[k, {k, y1, y2, h}]; 
      xvalues = Table[a Sin[(m ?)/2], {m, 0, n}]; 
      Line[Transpose[{xvalues, yvalues}]]]]

and

With[{size = .2}, 
  Animate[
    Graphics[{
      vspring[0.2, 0, 2 Sin[y]], 
      Red, Thickness[5 size], Line[{{-.5 size, 2 Sin[y]}, {.5 size, 2 Sin[y]}}]}, 
      PlotRange -> {{-size, size}, {-2.2 , 2 size}}], 
    {y, -?, 0, 0.1}]]

But I have one question. I should use this line:

Animate[Graphics[springmass[5 + Sin[?], 23],PlotRange -> {-9, 0}], {?, 0, 2 ?}]

The vspring function of the internet code have 3 parameters and the "required" line (the function springmass) have 2 parameters. How can I change that?

Thanks for your help!!!

POSTED BY: Patrik Resch
2 Replies
Posted 10 years ago

It is best to give your variables some plain understandable names. Like in you function:( this is a spring with diameter and start and endpoint)

springmass[start_: 0, end_, diameter_] := 
 Module[{a = diameter, y1 = start, y2 = end, n = 100}, h = (y2 - y1)/n;
  yvalues = Table[k, {k, y1, y2, h}];
  xvalues = Table[a Sin[(m \[Pi])/2], {m, 0, n}];
  Line[Transpose[{xvalues, yvalues}]]]

This will then make a simple manipulate:

Manipulate[With[{size = .2},
  Animate[
   Graphics[{
     vspring[diameter, start, 2 Sin[y]],
     Red, Thickness[5 size], 
     Line[{{-.5 size, 2 Sin[y]}, {.5 size, 2 Sin[y]}}]}, 
    PlotRange -> {{-size, size}, {-2.2, 2 size}}, Axes -> True, 
    ImageSize -> Small],
   {y, -\[Pi], 0, 0.1}]],
 {{diameter, .2}, .05, 1},
 {{start, 0}, -1, 1}]
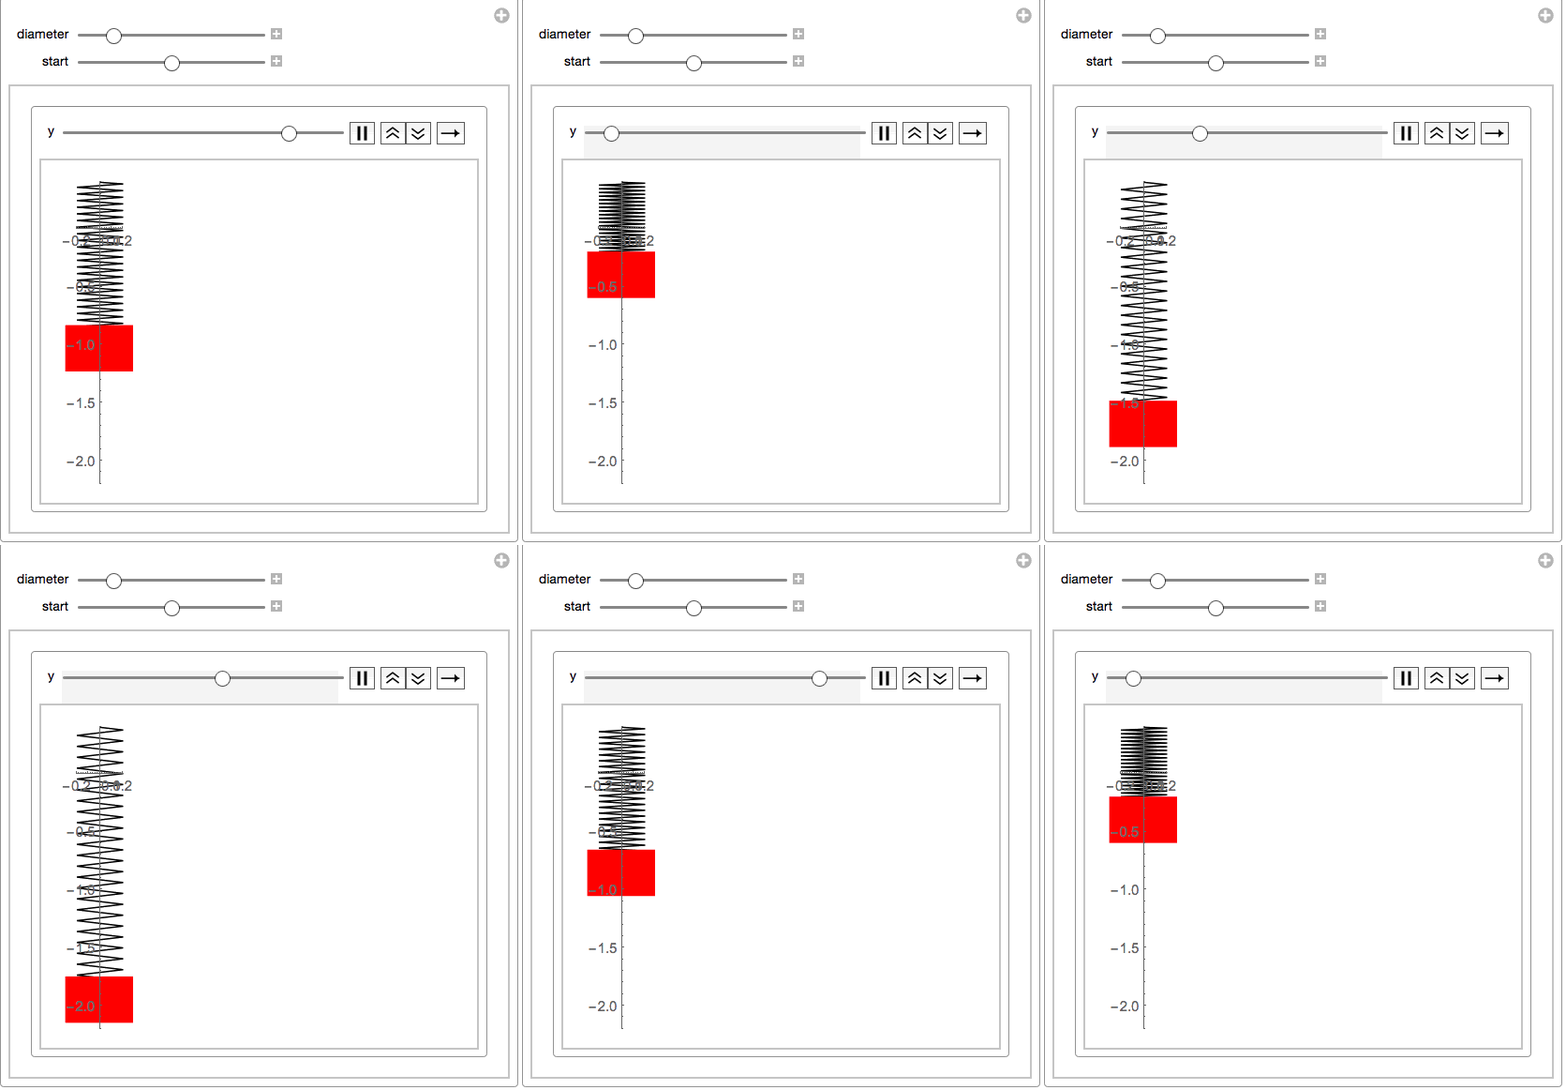
enter image description here

your function springs eliminates the strapping and considers it to be zero:springmass[start: 0, end, diameter_] := Module[{a = diameter, y1 = start, y2 = end, n = 100}, h = (y2 - y1)/n; yvalues = Table[k, {k, y1, y2, h}]; xvalues = Table[a Sin[(m [Pi])/2], {m, 0, n}]; Line[Transpose[{xvalues, yvalues}]]] This way no need for a third variable since the default value _:0 will be chosen.

Animate[Graphics[springmass[5 + Sin[\[CurlyPhi]], 1], 
  PlotRange -> {{-5, 5}, {0, 7}}, Axes -> True], {\[CurlyPhi], 0, 
  2 \[Pi]}]
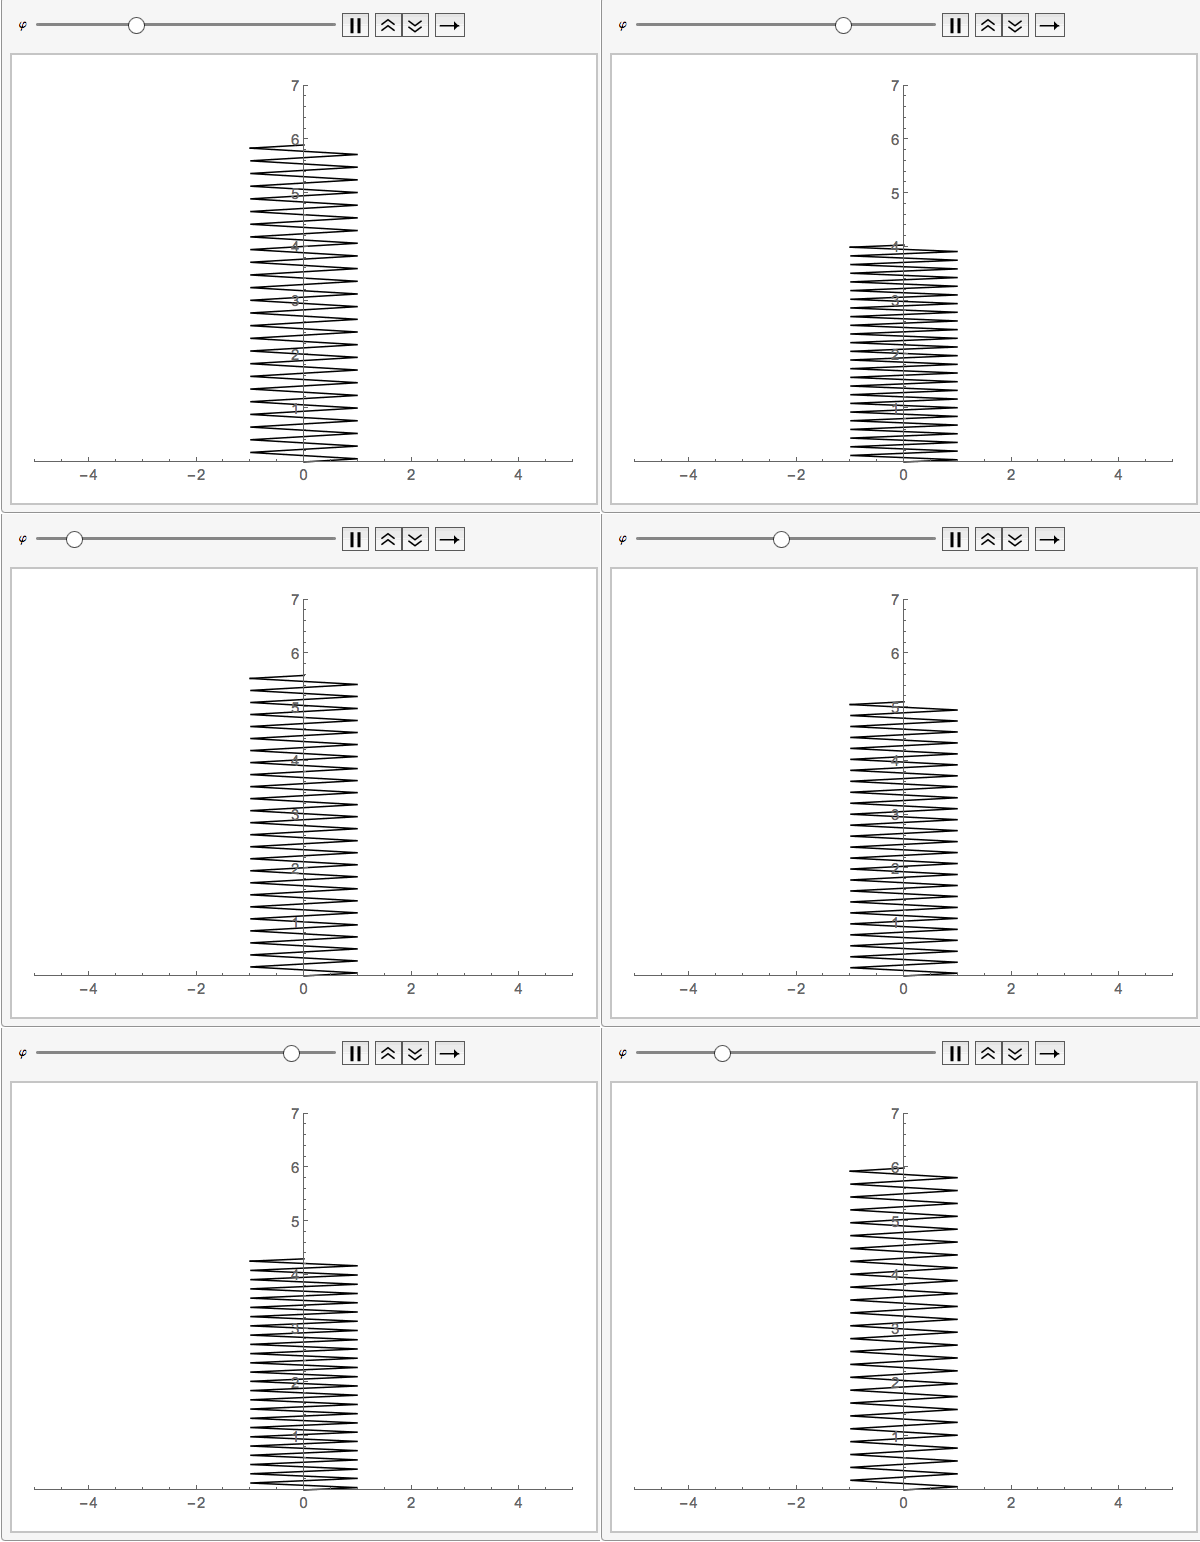
enter image description here

It is better to explain the question more in detail since it was hard to guess what this was all about. But this will hopefully be of help.

POSTED BY: Erik Mahieu
Reply to this discussion
Community posts can be styled and formatted using the Markdown syntax.
Reply Preview
Attachments
Remove
or Discard

Group Abstract Group Abstract