Message Boards Message Boards

"Plot3D" Not responding to changes in wave function conditions.

Posted 9 years ago

Hey all, I'm having trouble trying to plot the probability of finding an electron at a given point along the x-axis using Schrodinger's equation. I am successful in plotting the probability of a particle whose wave function is at the first energy level, but once I try to plot at any higher energy levels, nothing changes on the graph.

code

The plot does not change when I alter the coefficient of X in the cosine part of my piecewise conditions. The coefficient there represents the initial energy level of the electron in a box. The walls of the "box" are removed after t=0 and the particle's wavefunction is allowed to expand freely towards infinity.

Any ideas why this might be the case? Thanks! Chris Penney

POSTED BY: Chris Penney
5 Replies
Posted 9 years ago

I cannot copy yr code for testing, Either attach a .nb or use the "insert code sample" button.

POSTED BY: Erik Mahieu
Posted 9 years ago
sin = ClearAll
a = 50
T = 60000
L = \[Pi]
NDSolve[{I*\!\(
\*SubscriptBox[\(\[PartialD]\), \(t\)]\(y[x, t]\)\) + .0004*\!\(
\*SubscriptBox[\(\[PartialD]\), \(x, x\)]\(y[x, t]\)\) == 0, 
  y[-a, t] == y[a, t], 
  y[x, 0] == 
   Piecewise[{{0, x < -L/2}, {0, 
      x > L/2}, {Sqrt[2/L] Cos[x], -L/2 <= x <= L/2}}]}, y, {x, -a, 
  a}, {t, 0, T}]
Plot3D[Evaluate[Abs[y[x, t]] /. %], {x, -a, a}, {t, 0, T}, 
 PlotRange -> All, PlotPoints -> 200, MaxRecursion -> 2]

Sorry about that.

POSTED BY: Chris Penney
Posted 9 years ago

If you mean the initial condition y[x,0] in the box Sqrt[2/L], it does affect the result. Change it to a different value and evaluate both NDSolve and Plot3D and the plot does change, at least for me. BTW, it is good to avoid beginning user symbols with upper case, since they can conflict with built in symbols, like E, I, N, . . . Best, David

POSTED BY: David Keith
Posted 9 years ago

Since there is a parameter (It is not very clear what this parameter is but, I presume, like David, it is the initial condition y[x,0] (let it be alpha): In this case, ParametricNDSolve is a good choice

In[236]:= Clear[\[Alpha], sol, y]
a = 100; T = 60000; L = \[Pi];
sol = ParametricNDSolve[{I \!\(
\*SubscriptBox[\(\[PartialD]\), \(t\)]\(y[x, t]\)\) + .0004 \!\(
\*SubscriptBox[\(\[PartialD]\), \(x, x\)]\(y[x, t]\)\) == 0, 
    y[-a, t] == y[a, t], 
    y[x, 0] == 
     Piecewise[{{0, x < -(L/2)}, {0, 
        x > L/2}, {Sqrt[2/L] \[Alpha] Cos[x], -(L/2) <= x <= L/2}}]}, 
   y, {x, -a, a}, {t, 0, T}, {\[Alpha]}];
y /. sol
y[.1] /. sol
%[0., 0.5]

Out[239]= ParametricFunction[ <> ]

Out[240]= InterpolatingFunction[{{\[Ellipsis], -100., 
   100., \[Ellipsis]}, {0., 60000.}}, <>]

Out[241]= 0.0797883 - 5.73532*10^-7 I

and the Plot3D is really affected by the value of alpha as can be seen with a Manipulate:

Manipulate[
 Quiet@Plot3D[
   Evaluate[Abs[y[\[Alpha]][x, t]] /. sol], {x, -100, 100}, {t, -3.5, 
    3.5}, 
    PlotRange -> All, PlotPoints -> 50], {{\[Alpha], 1.57}, -5, 
  10, .01, Appearance -> "Labeled"}, SynchronousUpdating -> False]

![][1] 
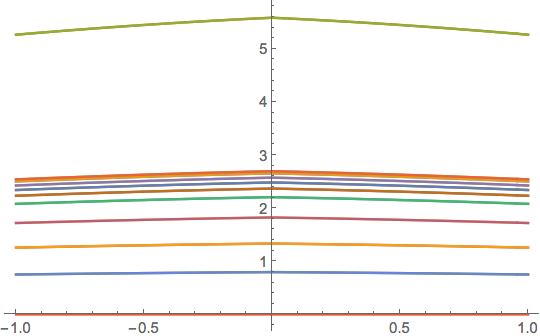
The effect of alpha can also be seen from the following plot:

Plot[Evaluate[
  Table[Abs[y[\[Alpha]][x, .95] /. sol], {\[Alpha], -10, 
    10}]], {x, -1, 1}]

enter image description here

POSTED BY: Erik Mahieu
Posted 9 years ago

Manipulate output did not get properly added

POSTED BY: Erik Mahieu
Reply to this discussion
Community posts can be styled and formatted using the Markdown syntax.
Reply Preview
Attachments
Remove
or Discard

Group Abstract Group Abstract