Hi, my name is Joseph. I'm new here, but I've known wolfram's technologies since some years ago. Please forgive me if I make some spelling mistakes, my english is not perfect.
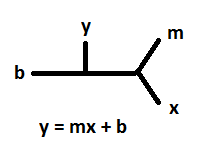
I've worked some years ago to develop a new way to express math relationships. I believe there must be another simpler and smarter way to express math, without disregarding the natural beauty of it. Eventually, I developed a simple math notation that, I think, fits my expectations and goals.
I also believe it has some unexpected adventages over traditional math notation:
- Order of operations is explicit; it's a non linear notation (it is diagram-based).
- Variable isolation to transform equations to other equivalent forms, is not requiered.
- Many orthodox equations can be represented at the same time using just a simple expression in this new notation.
- This new notation has less operators.
You can actually see the specification here (GItHub). More general information here.
I have not found another similar way to express math, so I dream it will be useful for educators and scientsts, someday.
I open this thread because I need your opinion, criticism and scrutiny. This is a big and organized forum, so I believe there are many brilliant people with a honest opinion to give. Suggestions are all welcome, and this notation open to changes and improvements based on your reviews.
Thanks.
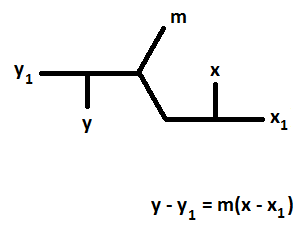
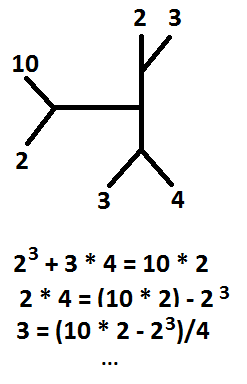
More examples