Hi,
I am stuck here for a while and any help would be greatly appreciated..
So this is the code,
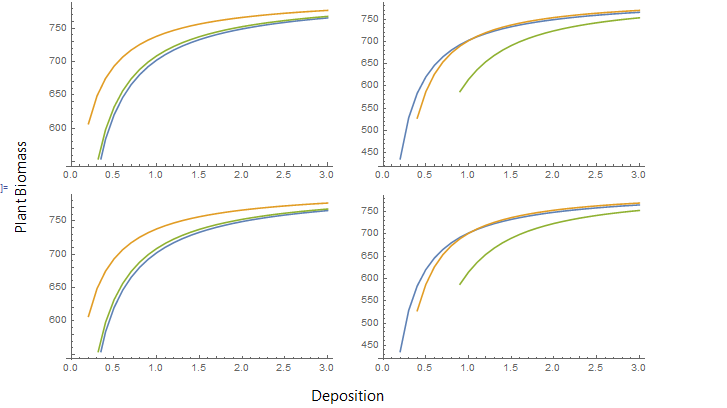
p1 = ListLinePlot[{t, t1, t2}]

p2 = ListLinePlot[{td, td1, td2}]

Panel[GraphicsGrid[{{p1, p2}, {p1, p2}}], {"Deposition", Rotate["Plant Biomass", Pi/2]}, {Bottom, Left}, Background -> White]
and I used this for creating a graphic grid

Now, I wanted to name those lines , For example Yellow line = plot 1, Green Line= plot2 and Blue line = plot 3.. I tried using Plotlegend and it seemingly does not work ..Is there any other alternative command for this?
Thanks in advance