Message Boards Message Boards

0
|
10707 Views
|
4 Replies
|
0 Total Likes
View groups...
Share
Share this post:

Plot legend

Posted 10 years ago

Hi,

I am stuck here for a while and any help would be greatly appreciated..

So this is the code,

p1 = ListLinePlot[{t, t1, t2}]

p2 = ListLinePlot[{td, td1, td2}]

Panel[GraphicsGrid[{{p1, p2}, {p1, p2}}], {"Deposition", Rotate["Plant Biomass", Pi/2]}, {Bottom, Left}, Background -> White]

and I used this for creating a graphic grid
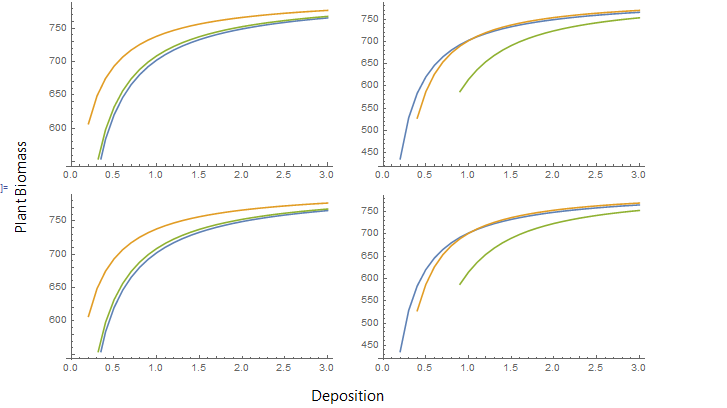
enter image description here

Now, I wanted to name those lines , For example Yellow line = plot 1, Green Line= plot2 and Blue line = plot 3.. I tried using Plotlegend and it seemingly does not work ..Is there any other alternative command for this?

Thanks in advance

POSTED BY: ash ash
4 Replies
Posted 10 years ago

Hi,

PlotLegend (with a capital L) works by calling the package PlotLegends

Needs["PlotLegends`"]

Otherwise you can also try PlotLegends (so with an 's' at the end) which does not need any package.

Best, Xavier

POSTED BY: Xavier Roy
Posted 10 years ago

Hi!

It doesnt really work.. Got an error saying Unknown option PlotLegends for Panel. >> It doesn't work along when creating a panel :(

POSTED BY: ash ash
Posted 10 years ago

PlotLegends should be an argument of ListLinePlot, for instance:

ListLinePlot[Prime[Range[25]], Filling -> Axis, PlotLegends -> "Prime Numbers"]
POSTED BY: Xavier Roy

The PlotLegends package is a bit old, but still useful.

You can also use LineLegend:

LineLegend[{Red, Green, Blue}, {"red", "green", "blue"}]

This creates a separate legend and then you can join it to the panel using GraphicsRow:

GraphicsRow[{Panel[...], LineLegend[...]}]
POSTED BY: Sean Clarke
Reply to this discussion
Community posts can be styled and formatted using the Markdown syntax.
Reply Preview
Attachments
Remove
or Discard

Group Abstract Group Abstract