Message Boards Message Boards

0
|
5012 Views
|
5 Replies
|
3 Total Likes
View groups...
Share
Share this post:

Evaluate "Plot" with specific spacing, say 0.1 by 0.1 to 0.9?

Posted 10 years ago

Hey,

I have a very "heavy" calculation, which I want to speed-up. How do I tell Mathematica to evaluate "Plot" with specific spacing, say 0.1 by 0.1 to 0.9? Instead of Plot[Func., {x,0.1,0.9}] which let's it choose the spacing itself? In Matlab, this is the difference between [0.1:0.9] and [0.1:0.1:0.9]...

Thanks! Erez .

POSTED BY: Erez A
5 Replies
Posted 10 years ago

The Joined option can be used to let DiscretePlot "fake" a continuous plot:

DiscretePlot[Sin[t], {t, 0, 2, 0.1}, Joined -> True, Filling -> None]

enter image description here

POSTED BY: Hans Milton
Posted 10 years ago

You can also use PlotPoints to set the number of initial points and MaxRecursion to prevent refinement. Of course the plot quality will suffer. (Mesh->Full just shows the points.)

Plot[Sin[x], {x, 0, 2 Pi}, PlotPoints -> 10, MaxRecursion -> 0, 
 Mesh -> Full]

enter image description here

POSTED BY: David Keith

Hi,

if you DecretePlot, you can use the option Filling->None to get rid of the vertical lines.

DiscretePlot[Sin[t], {t, 0.1, 0.9, 0.1}, Filling -> None]

Cheers,

Marco

POSTED BY: Marco Thiel
Posted 10 years ago

Hi Erez,

DiscretePlot does what you are looking for. An example with spacing 0.1:

DiscretePlot[Sin[t], {t, 0, 2, 0.1}]

enter image description here

POSTED BY: Hans Milton

Hi,

this is one way:

ListPlot[{#, Sin[#]} & /@ Range[0.1, 0.9, 0.1]]
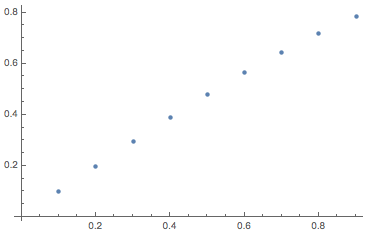
enter image description here

If you really want, you can do it with Plot, too, but it is really artificial:

Plot[Sin[t], {t, 0.0, 1}, Mesh -> {Range[0., 1, 0.1]}, MeshStyle -> Directive[Red, PointSize -> Large], PlotStyle -> None]
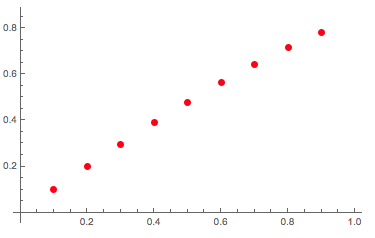
enter image description here

Cheers,

Marco

POSTED BY: Marco Thiel
Reply to this discussion
Community posts can be styled and formatted using the Markdown syntax.
Reply Preview
Attachments
Remove
or Discard

Group Abstract Group Abstract