Hi,
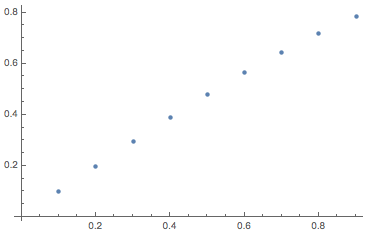
this is one way:
ListPlot[{#, Sin[#]} & /@ Range[0.1, 0.9, 0.1]]
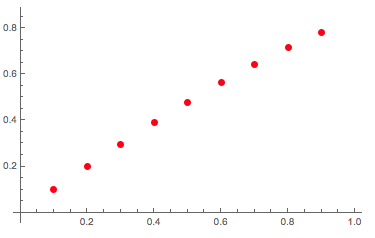
If you really want, you can do it with Plot, too, but it is really artificial:
Plot[Sin[t], {t, 0.0, 1}, Mesh -> {Range[0., 1, 0.1]}, MeshStyle -> Directive[Red, PointSize -> Large], PlotStyle -> None]
Cheers,
Marco


