Message Boards Message Boards

1
|
5928 Views
|
5 Replies
|
3 Total Likes
View groups...
Share
Share this post:

Too many markers with ProbabilityPlot and ProbabilityScalePlot

Dear Wolfram Community,

When I use PlotMarkers inside of ProbabilityScalePlot additional data points are added to the plot. This is even true for the examples given in the documentation. Where do these extra points come from and is it possible to get rid of them?

Best wishes,
Andy

Here is an example taken directly from the documentation:
data = Table[   RandomVariate[ParetoDistribution[p[[1]], p[[2]]],     20], {p, {{1, 2}, {4, 9}, {5, 7}, {7, 9}}}];
ProbabilityScalePlot[ ReleaseHold /@ {data[[#]] & /@ Range[Length@data]}, "Normal",  PlotMarkers -> Automatic]
ProbabilityScalePlot[ ReleaseHold /@ {data[[#]] & /@ Range[Length@data]}, "Normal"]
The plot with the PlotMarkers has extra blue filled in circles along the top and bottom, as higlighted by the red circles.


5 Replies
Andy,

I made a slight change to my original code. Previously, I had counted the number of plotmarkers by hand to come up with 10, but if any are added, then the solution will not include them. Of course, it is unlikely that you will need more than 10 plotmarkers, but in the unlikely event you do, I modified the code to grab the length of that list.

I have not played with Mesh -> Full, but I will look at it. Thanks.

Rob
POSTED BY: Robert Collyer
We'll look into this. One workaround is to apply the markers to the plot, yourself.

First, get a list of all the standard plot markers:
 {glen, glyphs} = {Length@#, #}& @

  Cases[
   Normal@ListPlot[ConstantArray[{1}, 50], PlotMarkers -> Automatic],
   Inset[glyph_, ___] :> glyph,

   Infinity] // DeleteDuplicates

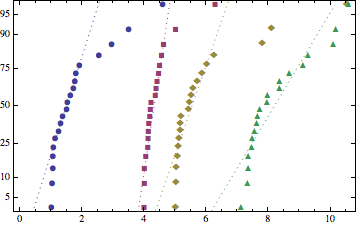
Then, perform the replacement:

Module[{i = 0},
  Normal[ProbabilityScalePlot[ReleaseHold /@ {data[[#]] & /@ Range[Length@data]}, "Normal"]] /.
    {_Hue, col_RGBColor, p_Point} :>
       Module[{glyph = glyphs[[Mod[++i, glen, 1]]]}, {col, Inset[glyph, #] & /@ p[[1]]}]
]
POSTED BY: Robert Collyer
Dear Robert,

Thank you very much for your excellent response. I learned a lot decomposing your solution.

I've also found another "workaround" which is to set Mesh->Full. For some reason this gets rid of the excess data points. I have no idea why it works, but it seems to.

Best,
Andy
Dear Vitaliy,

Thank you for adding the pictures. I wasn't able to figure out how to add in the diagrams myself using the local links. But I've figured out how to do it by importing a file containing the pictures. I've also circled and highlghted in red the extra points which arise from the PlotMarkers.

Best,
Andy
Andy I added images to your post - you could do that yourself to, especially in the case when you have a graphics question. This is to just add clarity. For example I am still not sure which points you mean. Do you just mean only 1st plot and and markers at level 0 and level 100?
POSTED BY: Vitaliy Kaurov
Reply to this discussion
Community posts can be styled and formatted using the Markdown syntax.
Reply Preview
Attachments
Remove
or Discard

Group Abstract Group Abstract