Message Boards Message Boards

6
|
9974 Views
|
6 Replies
|
18 Total Likes
View groups...
Share
Share this post:

Numerical solution for non linear Klein Gordon equation in 3+1 dimensions

We are looking into numerical solution of nonlinear Klein Gordon equation in 3+1 dimensions with periodic boundary conditions. We use a Gaussian as an initial condition. The problem could be solved for a small interval of time t=1. However NDSolve fails and show a ndsz error for higher values of t. We are attaching some plots for the solution we obtained so far.
l=5;k=1;Tf=1;u4[x_,y_,z_,t_]:=Exp[-x^2-y^2-z^2];dim4=NDSolve[{D[u[x,y,z,t],{t,2}]-D[u[x,y,z,t],{x,2}]-D[u[x,y,z,t],{y,2}]+D[u[x,y,z,t],{z,2}]+u[x,y,z,t]-k (u[x,y,z,t])^3==0,u[x,y,z,0]==u4[x,y,z,0],Derivative[0,0,0,1][u][x,y,z,0]==Derivative[0,0,0,1][u4][x,y,z,0],u[-l,y,z,t]==u[l,y,z,t],u[x,-l,z,t]==u[x,l,z,t],u[x,y,-l,t]==u[x,y,l,t]},u,{t,0,Tf},{x,-l,l},{y,-l,l},{z,-l,l}, Method->{"MethodOfLines","SpatialDiscretization"->{"TensorProductGrid","DifferenceOrder"->"Pseudospectral"}}]
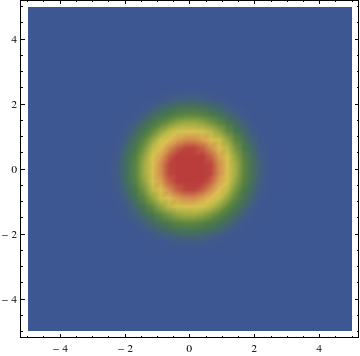
We look at a plot for a fixed value of t and z. Its a slice of the four dimensional space which is seen.
DensityPlot[Evaluate[u[x,y,0,1]/.dim4],{x,-l,l},{y,-l,l},PlotRange->All,ColorFunction->"DarkRainbow",PlotPoints->40] 

When we try to solve it for larger time intervals we end up with an error as shown below.
l=5;k=1;Tf=2;u4[x_,y_,z_,t_]:=Exp[-x^2-y^2-z^2];dim2=NDSolve[{D[u[x,y,z,t],{t,2}]-D[u[x,y,z,t],{x,2}]-D[u[x,y,z,t],{y,2}]+D[u[x,y,z,t],{z,2}]+u[x,y,z,t]-k (u[x,y,z,t])^3==0,u[x,y,z,0]==u4[x,y,z,0],Derivative[0,0,0,1][u][x,y,z,0]==Derivative[0,0,0,1][u4][x,y,z,0],u[-l,y,z,t]==u[l,y,z,t],u[x,-l,z,t]==u[x,l,z,t],u[x,y,-l,t]==u[x,y,l,t]},u,{t,0,Tf},{x,-l,l},{y,-l,l},{z,-l,l},Method->{"MethodOfLines","SpatialDiscretization"->{"TensorProductGrid","DifferenceOrder"->"Pseudospectral"}}] 
We get the follwing error for large time interval.
NDSolve::ndsz: At t == 1.7240917274928276`, step size is effectively zero; singularity or stiff system suspected.
It will be great if some one help me out with this.
POSTED BY: Arnab Kar
6 Replies
Hi,

Why is the sign of the term D[u[x,y,z,t],{z,2}] positive? Shouldn't it be negative as in the x and y terms? If I change that sign the evolution proceeds normally. I've played a bit more with the equations, for longer times. I think the coupling constant k=1 is too strong, and leads to singularities too soon. Using k=0.5 produces nice evolutions for longer times. (Provided that the sign of the z-term is fixed).

Jose.

Hi Arnab,

It took me much less than that, but it may be because I used a development version of Mathematica to run your code.

Note that the pretty wavefront diagram in the image I attached was not produced by the nonlinear term, but by the boundary conditions, and therefore you can get it also with smaller coupling constants. In particular, I chose time 10 to make it coincide with the crossing time of the box (size 2*l =10 and speed 1). The imprint of the boundaries in the pattern is even clearer if you look at the field profile at earlier times . For example (this was with k=0.05):

Jose.

Posted 11 years ago
This works quite nicely. Notice the use of "StifnessSwitching". As you get closer to the true singularity, integration times will go up rapidly.

l=5;k=1;Tf=4;u4[x_,y_,z_,t_]:=Exp[-x^2-y^2-z^2];dim4=NDSolve[{D[u[x,y,z,t],{t,2}]-D[u[x,y,z,t],{x,2}]-D[u[x,y,z,t],{y,2}]-D[u[x,y,z,t],{z,2}]+u[x,y,z,t]-k (u[x,y,z,t])^3==0,u[x,y,z,0]==u4[x,y,z,0],Derivative[0,0,0,1][u][x,y,z,0]==Derivative[0,0,0,1][u4][x,y,z,0],u[-l,y,z,t]==u[l,y,z,t],u[x,-l,z,t]==u[x,l,z,t],u[x,y,-l,t]==u[x,y,l,t]},u,{t,0,Tf},{x,-l,l},{y,-l,l},{z,-l,l},Method->{"TimeIntegration"->"StiffnessSwitching","PDEDiscretization"->{"MethodOfLines","SpatialDiscretization"->{"TensorProductGrid","DifferenceOrder"->"Pseudospectral"}}}
POSTED BY: Itai Seggev
Hi Jose, 

Thanks a lot for your help. You were right about the sign.

However when I tried running the code with k=0.5 for about 40 minutes it did not give me a result. When I ran it for k=0.2, I did get a result in 3 secs. Could you let me know how long you ran the code  to get the result? 
POSTED BY: Arnab Kar
Hi Jose,

Thanks a lot for your help. I was able to generate the plot this time with low value of k. 

But I was still wondering if there was any way to avoid that ndsz error which shows up for higher values of k. I know the non linearity is still preserved but it is made weaker by choosing a low value. 

Thanks once more.
POSTED BY: Arnab Kar
Thanks a lot Itai. It worked for me. 

I will try running it for a longer time and see if a large time interval works for it or not. 
POSTED BY: Arnab Kar
Reply to this discussion
Community posts can be styled and formatted using the Markdown syntax.
Reply Preview
Attachments
Remove
or Discard

Group Abstract Group Abstract