Message Boards Message Boards

1
|
4754 Views
|
10 Replies
|
12 Total Likes
View groups...
Share
Share this post:

How to get a BezierFunction to give the same curve as a BezierCurve?

Posted 9 years ago

BezierCurve is a graphics primitive, BezierFunction creates a function. How can I use the later to get the same curve as with the former? Motivation: I need to discretize such a curve, as imported from a PDF document. Please see here for (much) more information about my actual problem:

Here's what I tried. How should I use BezierFunction to get the same thing as BezierCurve? Unfortunately I don't know much about Bezier curves.

pt = {{85.6699`, 270.639`}, {81.4849`, 
    265.53000000000003`}, {72.1939`, 247.082`}, {69.5059`, 
    244.27`}, {66.8189`, 241.46`}, {65.39789999999999`, 
    237.92700000000002`}, {64.1759`, 236.649`}, {62.9539`, 
    235.372`}, {75.0969`, 229.142`}, {76.6069`, 
    228.67600000000002`}, {78.11789999999999`, 228.21`}, {75.1319`, 
    234.644`}, {75.2469`, 237.147`}, {75.3609`, 239.65`}, {80.5859`, 
    252.02`}, {82.9949`, 256.076`}, {85.4049`, 
    260.13100000000003`}, {92.1679`, 270.779`}, {93.5919`, 
    274.19`}, {95.0159`, 277.6`}, {92.9719`, 279.555`}, {85.6699`, 
    270.639`}};

ParametricPlot[BezierFunction[pt][x], {x, 0, 1}, 
 Epilog -> {BezierCurve[pt]}]

POSTED BY: Szabolcs Horvát
10 Replies

Thanks to help from Shutao Tang, I have a solution. BezierFunction[pt] is the equivalent of BezierCurve[pt, SplineDegree -> Length[pt]-1]. The default SplineDegree is 3. To achieve the same result as produced by a BezierCurve, we need to stitch together several BezierFunctions created from 4 (or less) points, like so:

funs = BezierFunction /@ Partition[pt, 4, 3, {1,1}, {}];
Show[Table[ParametricPlot[f[x], {x, 0, 1}], {f, funs}], PlotRange -> All]
POSTED BY: Szabolcs Horvát
Posted 9 years ago
POSTED BY: Eric Rimbey

I think you need to use the BernstainBasis, something similar to:

pts = {{1, 0}, {1, 2}, {2, -1}, {3, 2}};
f[t_] := Sum[pts[[i + 1]] BernsteinBasis[3, i, t], {i, 0, 3}]
ParametricPlot[f[t], {t, 0, 1}, Frame -> True, PlotRange -> All, Prolog -> {Thickness[0.01], Dashed, CapForm[None], Red, BezierCurve[pts, SplineDegree -> 3]}, PlotStyle -> Black]

Depending on your knots expanding to more points might be tricky...

enter image description here

POSTED BY: Sander Huisman

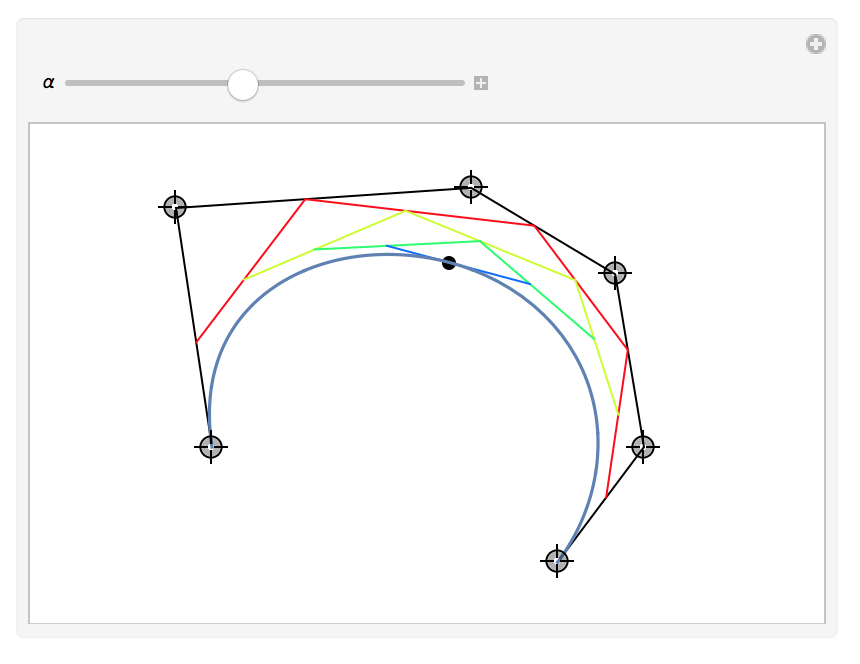
Or do it yourself, the construction is quite easy:

enter image description here

Clear[Smoothed, CreateGraphics]
Smoothed[pts_List, \[Alpha]_?
   NumericQ] := {1 - \[Alpha], \[Alpha]}.# & /@ Partition[pts, 2, 1]
CreateGraphics[pts_List, \[Alpha]_] := 
 Module[{sublines, smooth, \[Theta], gr},
  sublines = NestList[Smoothed[#, \[Alpha]] &, pts, Length[pts] - 2];
  smooth = Nest[Smoothed[#, \[Theta]] &, pts, Length[pts] - 1];
  sublines = 
   Riffle[Line /@ sublines, Hue /@ Range[0, 1, 1/(Length[pts] - 1)]];
  gr = ParametricPlot[smooth, {\[Theta], 0, 1}];
  Show[{Graphics[{sublines, PointSize[Large], 
      Point[smooth /. \[Theta] -> \[Alpha]]}], gr}, 
   PlotRange -> {{-2, 3}, {-1, 2}}]
  ]

Manipulate[
 CreateGraphics[
  pt, \[Alpha]], {{pt, {{-1, 0}, {-0.8, 1.6}, {0.8, 1.8}, {1.8, 
     1.2}, {2, 0}, {1.4, -0.8}}}, Locator, 
  LocatorAutoCreate -> {3, 8}}, {{\[Alpha], 0.3}, 0, 1}]

giving:

enter image description here

POSTED BY: Sander Huisman

What do you think about the discrepancy between BezierCurve and its DiscretizeGraphics version (this is where the question came from)?

Consider

pt = {{93.2759`, 277.0452`}, {90.6249`, 273.3252`}, {79.7499`, 
    255.70020000000002`}, {76.9999`, 250.70020000000002`}, {74.2499`, 
    245.70020000000002`}, {70.2499`, 237.70020000000002`}, {69.9999`, 
    235.32520000000002`}};

g = Graphics[{BezierCurve[pt]}];
Show[DiscretizeGraphics[g], g]

The discretized version doesn't quite match up. There is a small but consistent difference between the curves. Also, the bottom endpoint doesn't match. Bug?

enter image description here

POSTED BY: Szabolcs Horvát

Doesn't this do exactly the same thing as BezierFunction? I mean, it is still necessary to stitch together multiple degree-3 parts with this method too.

POSTED BY: Szabolcs Horvát

Correct. But then you have the real formula, not a 'bezier-object'.

POSTED BY: Sander Huisman

Maybe a bug, maybe some accuracy thing (though I tried AccuracyGoal, PrecisionGoal, MaxCellMeasure et cetera to improve but to no avail).

pt = {{0, 0}, {0, 1}, {1, 1}, {1, 0}, {2, 0}};
g = Graphics[{BezierCurve[pt]}];
Show[DiscretizeGraphics[g], g]

enter image description here

Maybe also something to do with the default SplineDegree....

POSTED BY: Sander Huisman

Based on your example: This is a bug, no doubt. DiscretizeGraphics makes the exact same mistake I made. It simply uses BezierFunction with all the points form the BezierCurve, ending up with a single high degree function instead of a combination of several degree-3 ones.

pt = {{0, 0}, {0, 1}, {1, 1}, {1, 0}, {2, 0}};
g = Graphics[{BezierCurve[pt]}];
Show[g, ParametricPlot[BezierFunction[pt][x], {x, 0, 1}, 
  PlotStyle -> Orange], DiscretizeGraphics[g]]

enter image description here

POSTED BY: Szabolcs Horvát

Indeed! Good hunting! Now, it would be nice is there was a @mathematicabugreport account. So you could just submit this by mentioning it....

POSTED BY: Sander Huisman
Reply to this discussion
Community posts can be styled and formatted using the Markdown syntax.
Reply Preview
Attachments
Remove
or Discard

Group Abstract Group Abstract