Hi,
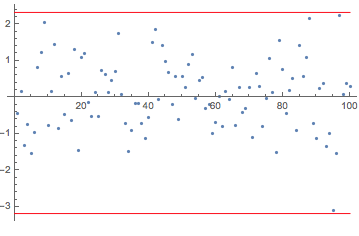
I am not sure whether I understand your question. If you have data and you take the max and the min you would get upper and lower bounds.
data = RandomVariate[NormalDistribution[], 100]; \[Epsilon] =
 0.1*Variance[data];
ListPlot[data,
 Epilog -> {Red,
   Line[{{0, Max[data] + \[Epsilon]}, {Length[data],
      Max[data] + \[Epsilon]}}], Red,
   Line[{{0, Min[data] - \[Epsilon]}, {Length[data],
      Min[data] - \[Epsilon]}}]}]
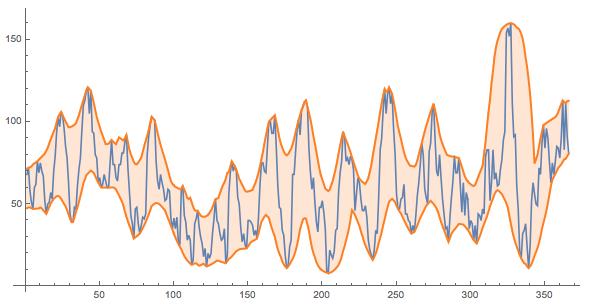
I believe that this technically solves your problem. I generate two curves, which bound the time series. But this appears to be too easy to be your problem. So probably your are interested in something they call "the envelop". Perhaps this post helps you. You might also like this demonstration, which contains this piece of code:
Manipulate[
 ListLinePlot[{data,
   EstimatedBackground[data, \[Sigma],
    Method -> {"SNIP", r}], -EstimatedBackground[-data, \[Sigma],
     Method -> {"SNIP", r}]}, AspectRatio -> 1/2, ImageSize -> Medium,
   PlotStyle -> {Automatic, {Orange, Thick}, {Orange, Thick}},
  Filling -> {2 -> {3}}], {{\[Sigma], 10}, 2, 30, 1}, {r, 0, 20},
 Initialization :> (data =
    WolframAlpha[
      "sunspot", {{"SunspotsPartialTimeSeries:SpaceWeatherData", 1},
       "TimeSeriesData"}][[All, 2]])]
This suggests that you need to be more specific regarding your objective. There are parameters in here ("how smooth do I want the envelope to be?"), which need to be included in the original question.
Note that the core of the animation is the EstimatedBackground function which is new in MMA10.
ListLinePlot[{data,
  EstimatedBackground[data, 5,
   Method -> {"SNIP", 0.1}], -EstimatedBackground[-data, 5,
    Method -> {"SNIP", 0.1}]}, AspectRatio -> 1/2, ImageSize -> Large,
  PlotStyle -> {Automatic, {Orange, Thick}, {Orange, Thick}},
 Filling -> {2 -> {3}}]
I hope that this helps you to find a solution to your problem.
Cheers,
Marco


