Message Boards Message Boards

0
|
7358 Views
|
4 Replies
|
1 Total Likes
View groups...
Share
Share this post:

How to plot f[n_] := n f[n - 1] a recursion equation?

How do you plot a recursion equation such as

f[n_] := n f[n - 1]

Thanks, Jake

POSTED BY: Jake Trexel
4 Replies

Thank you very much for your help Jake

POSTED BY: Jake Trexel

Again, same as with other functions. My recommendation is reading docs - there are many good examples there.

Clear[f, g];
f[1] = Pi;
f[n_] := f[n] = n f[n - 1];
g[1] = 2;
g[n_] := g[n] = n^3 + g[n - 1]

ListLinePlot[{
  Table[f[n], {n, 1, 5}],
  Table[g[n], {n, 1, 5}]
  }, PlotTheme -> "Business"]
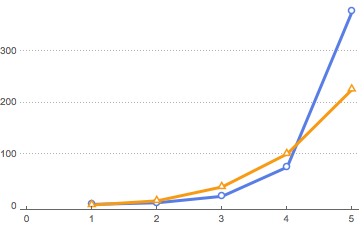
enter image description here

POSTED BY: Vitaliy Kaurov

Thank you. If you don't mind how would I plot two different functions to see if there intersection? Thanks again Jake

POSTED BY: Jake Trexel

As any data- or discrete- function.

Clear@f
f[1] = Pi;
f[n_] := f[n] = n f[n - 1]

ListLinePlot[Table[f[n], {n, 1, 5}], PlotTheme -> "Business"]

enter image description here

DiscretePlot[f[n], {n, 5}, PlotTheme -> "Business"]

enter image description here

POSTED BY: Vitaliy Kaurov
Reply to this discussion
Community posts can be styled and formatted using the Markdown syntax.
Reply Preview
Attachments
Remove
or Discard

Group Abstract Group Abstract