Recently Beijing issued the first red alert for its air pollution, which means the PM2.5 level was forecast to stay above 200 ug/m^3 for at least 72 consecutive hours. This makes me wonder what the historical data about the air quality in China looks like.
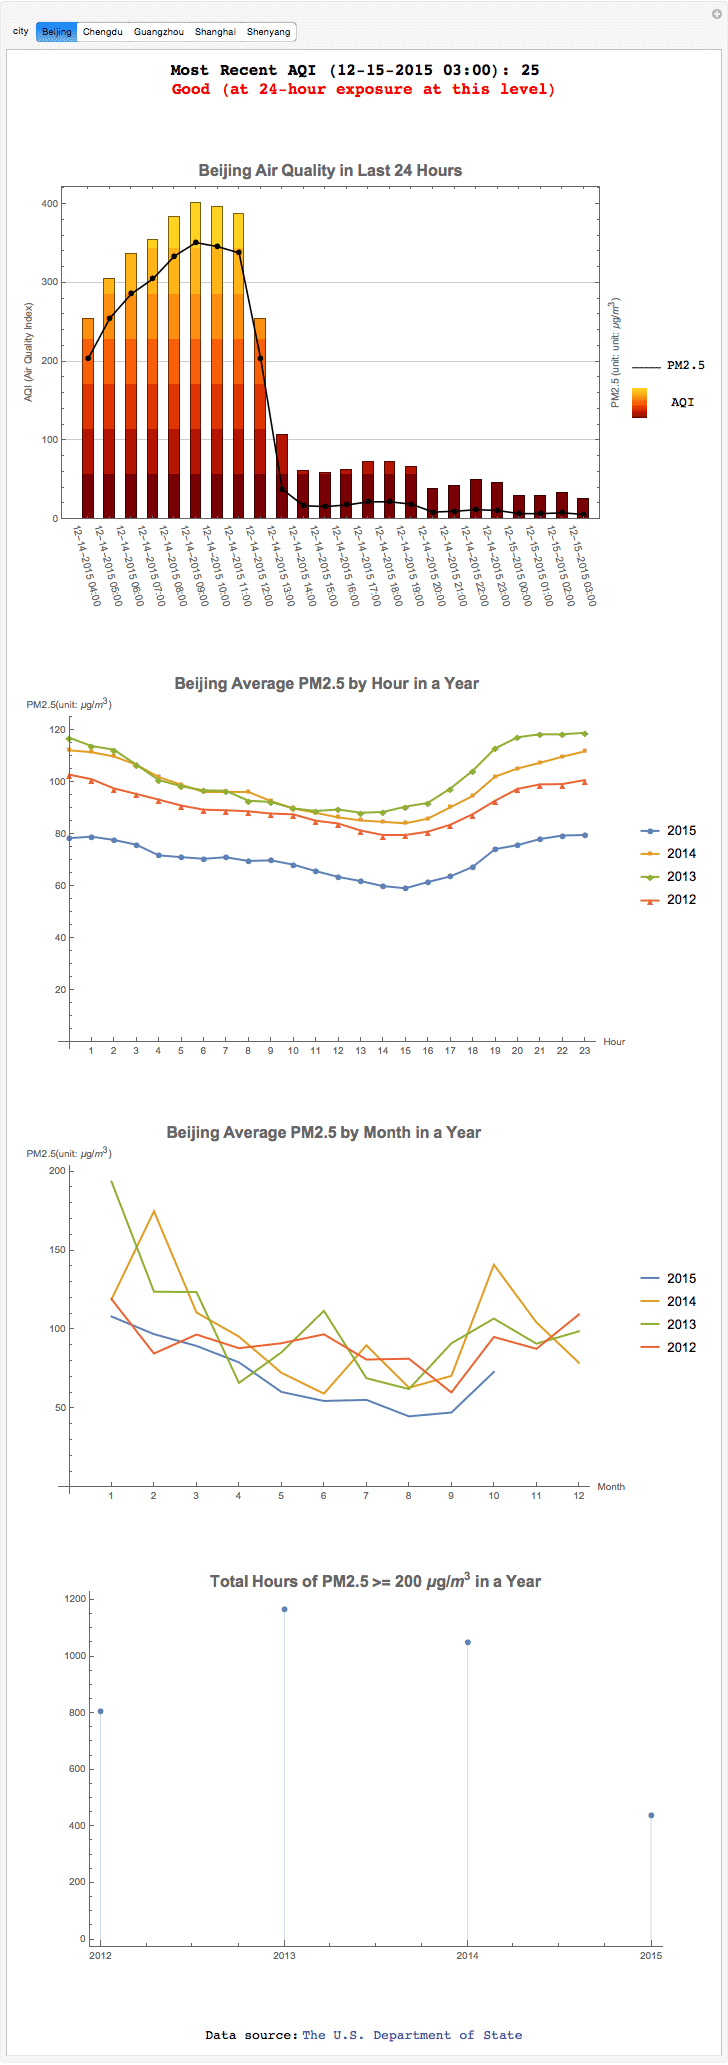
The US Department of State provides a nice set of data on some major cities in China. So I used their RSS feed and historical data (this year's data ends in Oct.) to create a CDF file. The source code and everything is in the attached CDF file, and here is a screenshot (Note that some drastic measures must have been taken by the authority in Beijing since the figures dramatically dropped at local time 1pm on Dec. 14, and remained low since then):

The plots describes the following things about the AQ in a given city:
- The most recent air quality
- the air quality in last 24 hours
- the average PM2.5 by hour in last few years
- the average PM2.5 by month in last few years
- the total hours of PM2.5 >=200 in last few years
Overall, the air quality seems better off in warmer days than that in winter across different cities. It also shows that due to different sources of pollutants and geo locations etc., different cities are showing different patterns of air quality on an average day. For example, Beijing seems to suffer worse air pollution during night, while Shanghai seems to have peaks of PM2.5 during the morning and afternoon rush hours. If the data is correct, something reassuring to people in China is that no matter how bad the pollution is right now, it used to be worse in the past years. (even though this year's data is incomplete).
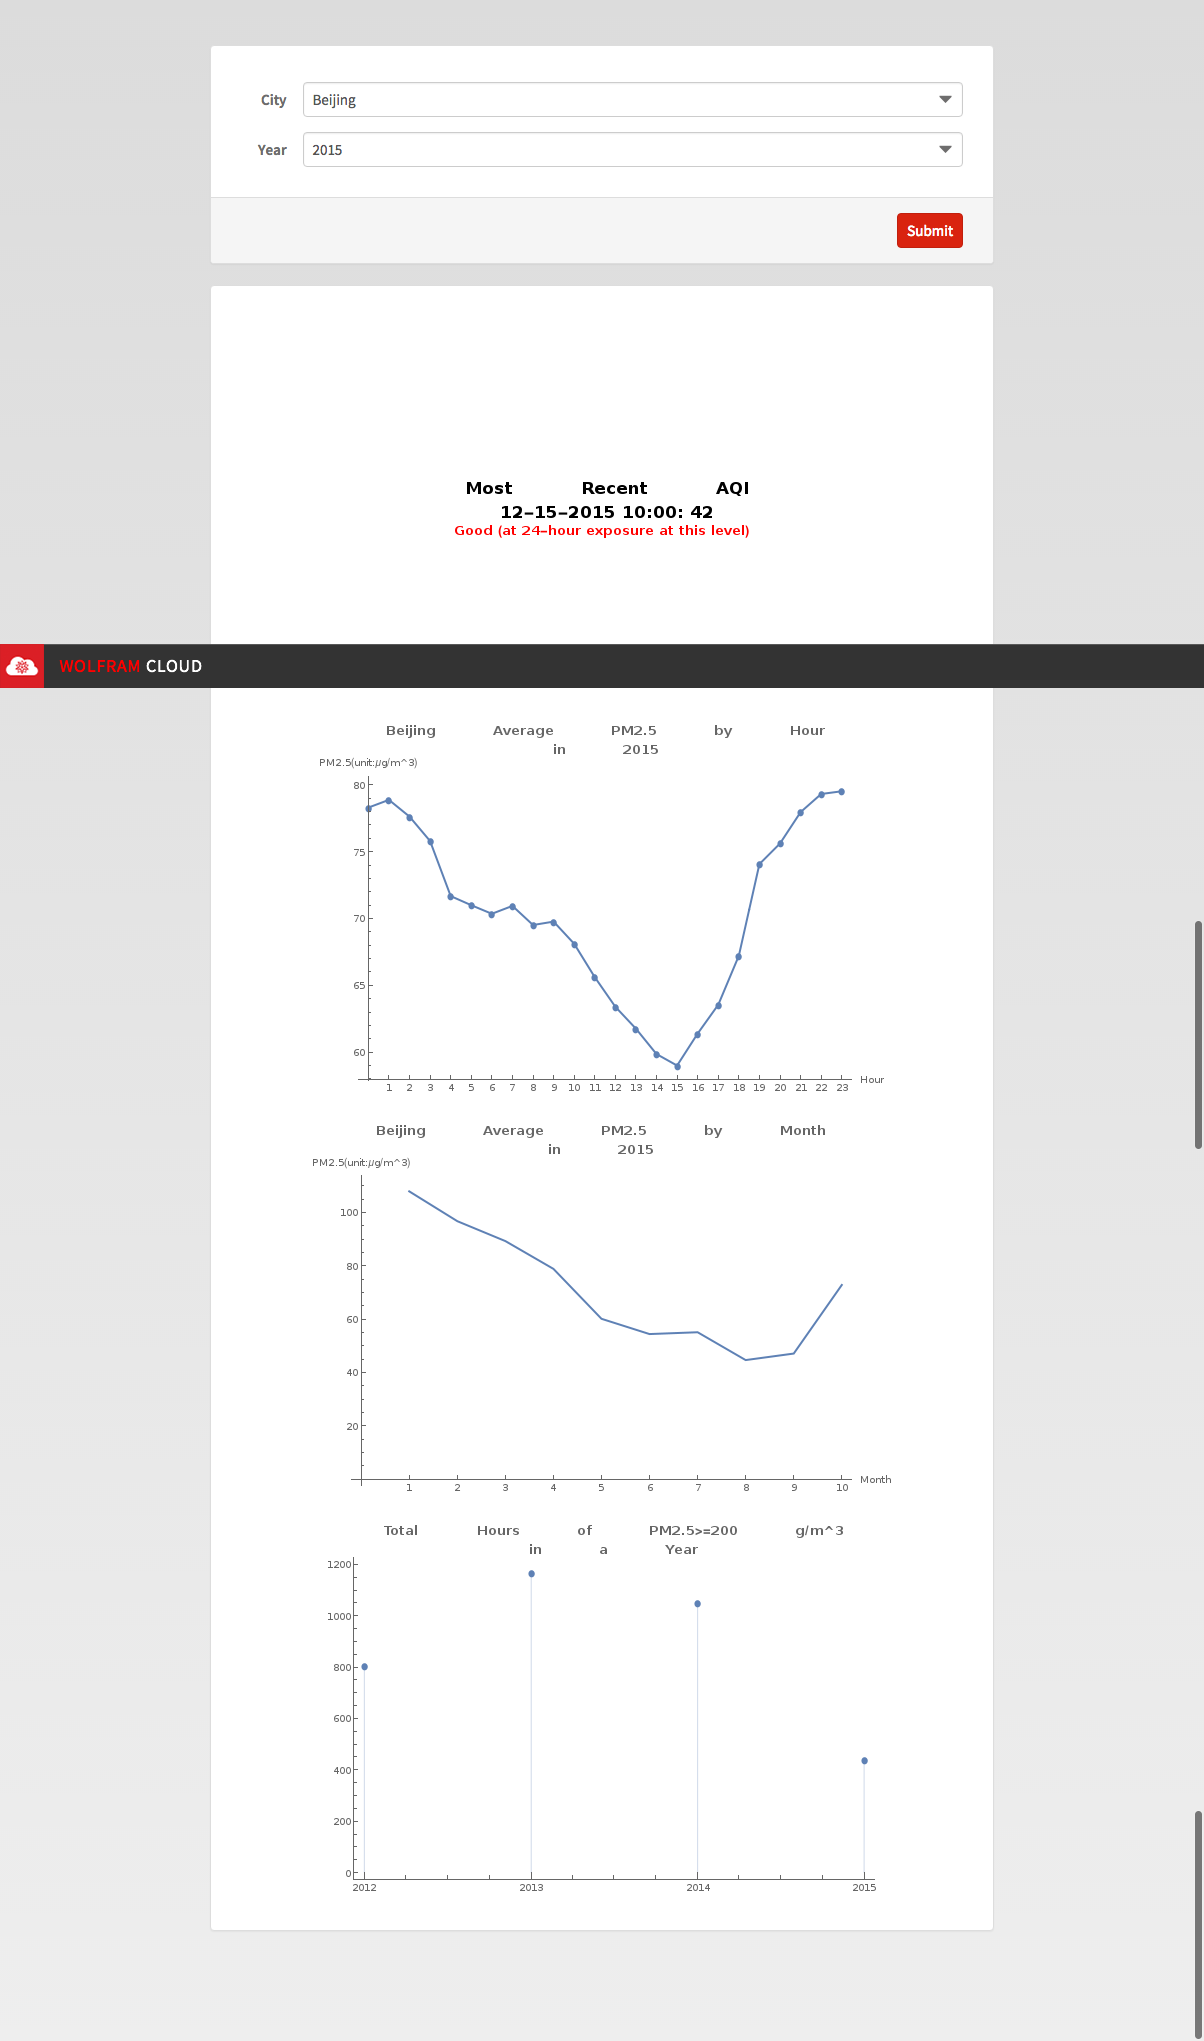
While some of things do not work in Wolfram Cloud yet (but coming soon), I created a page using FormPage (a tip from @Vitaliy Kaurov ) with some simpler version of the plots. It is exciting to see a dynamic form can be deployed at the cloud with just a few lines of code. Here is a full page screenshot:

I found it odd that the spaces in the text I entered as plot label got trimmed in the cloud, so I have to explicitly use tab "\t" and new line "\n" to separate the words. This explains the odd display of some lines.
 Attachments: