Group Abstract Group Abstract

Message Boards Message Boards

Display the air quality in some major cities in China

Posted 10 years ago

Recently Beijing issued the first red alert for its air pollution, which means the PM2.5 level was forecast to stay above 200 ug/m^3 for at least 72 consecutive hours. This makes me wonder what the historical data about the air quality in China looks like.

The US Department of State provides a nice set of data on some major cities in China. So I used their RSS feed and historical data (this year's data ends in Oct.) to create a CDF file. The source code and everything is in the attached CDF file, and here is a screenshot (Note that some drastic measures must have been taken by the authority in Beijing since the figures dramatically dropped at local time 1pm on Dec. 14, and remained low since then):

enter image description here

The plots describes the following things about the AQ in a given city:

  1. The most recent air quality
  2. the air quality in last 24 hours
  3. the average PM2.5 by hour in last few years
  4. the average PM2.5 by month in last few years
  5. the total hours of PM2.5 >=200 in last few years

Overall, the air quality seems better off in warmer days than that in winter across different cities. It also shows that due to different sources of pollutants and geo locations etc., different cities are showing different patterns of air quality on an average day. For example, Beijing seems to suffer worse air pollution during night, while Shanghai seems to have peaks of PM2.5 during the morning and afternoon rush hours. If the data is correct, something reassuring to people in China is that no matter how bad the pollution is right now, it used to be worse in the past years. (even though this year's data is incomplete).

While some of things do not work in Wolfram Cloud yet (but coming soon), I created a page using FormPage (a tip from @Vitaliy Kaurov ) with some simpler version of the plots. It is exciting to see a dynamic form can be deployed at the cloud with just a few lines of code. Here is a full page screenshot:

enter image description here

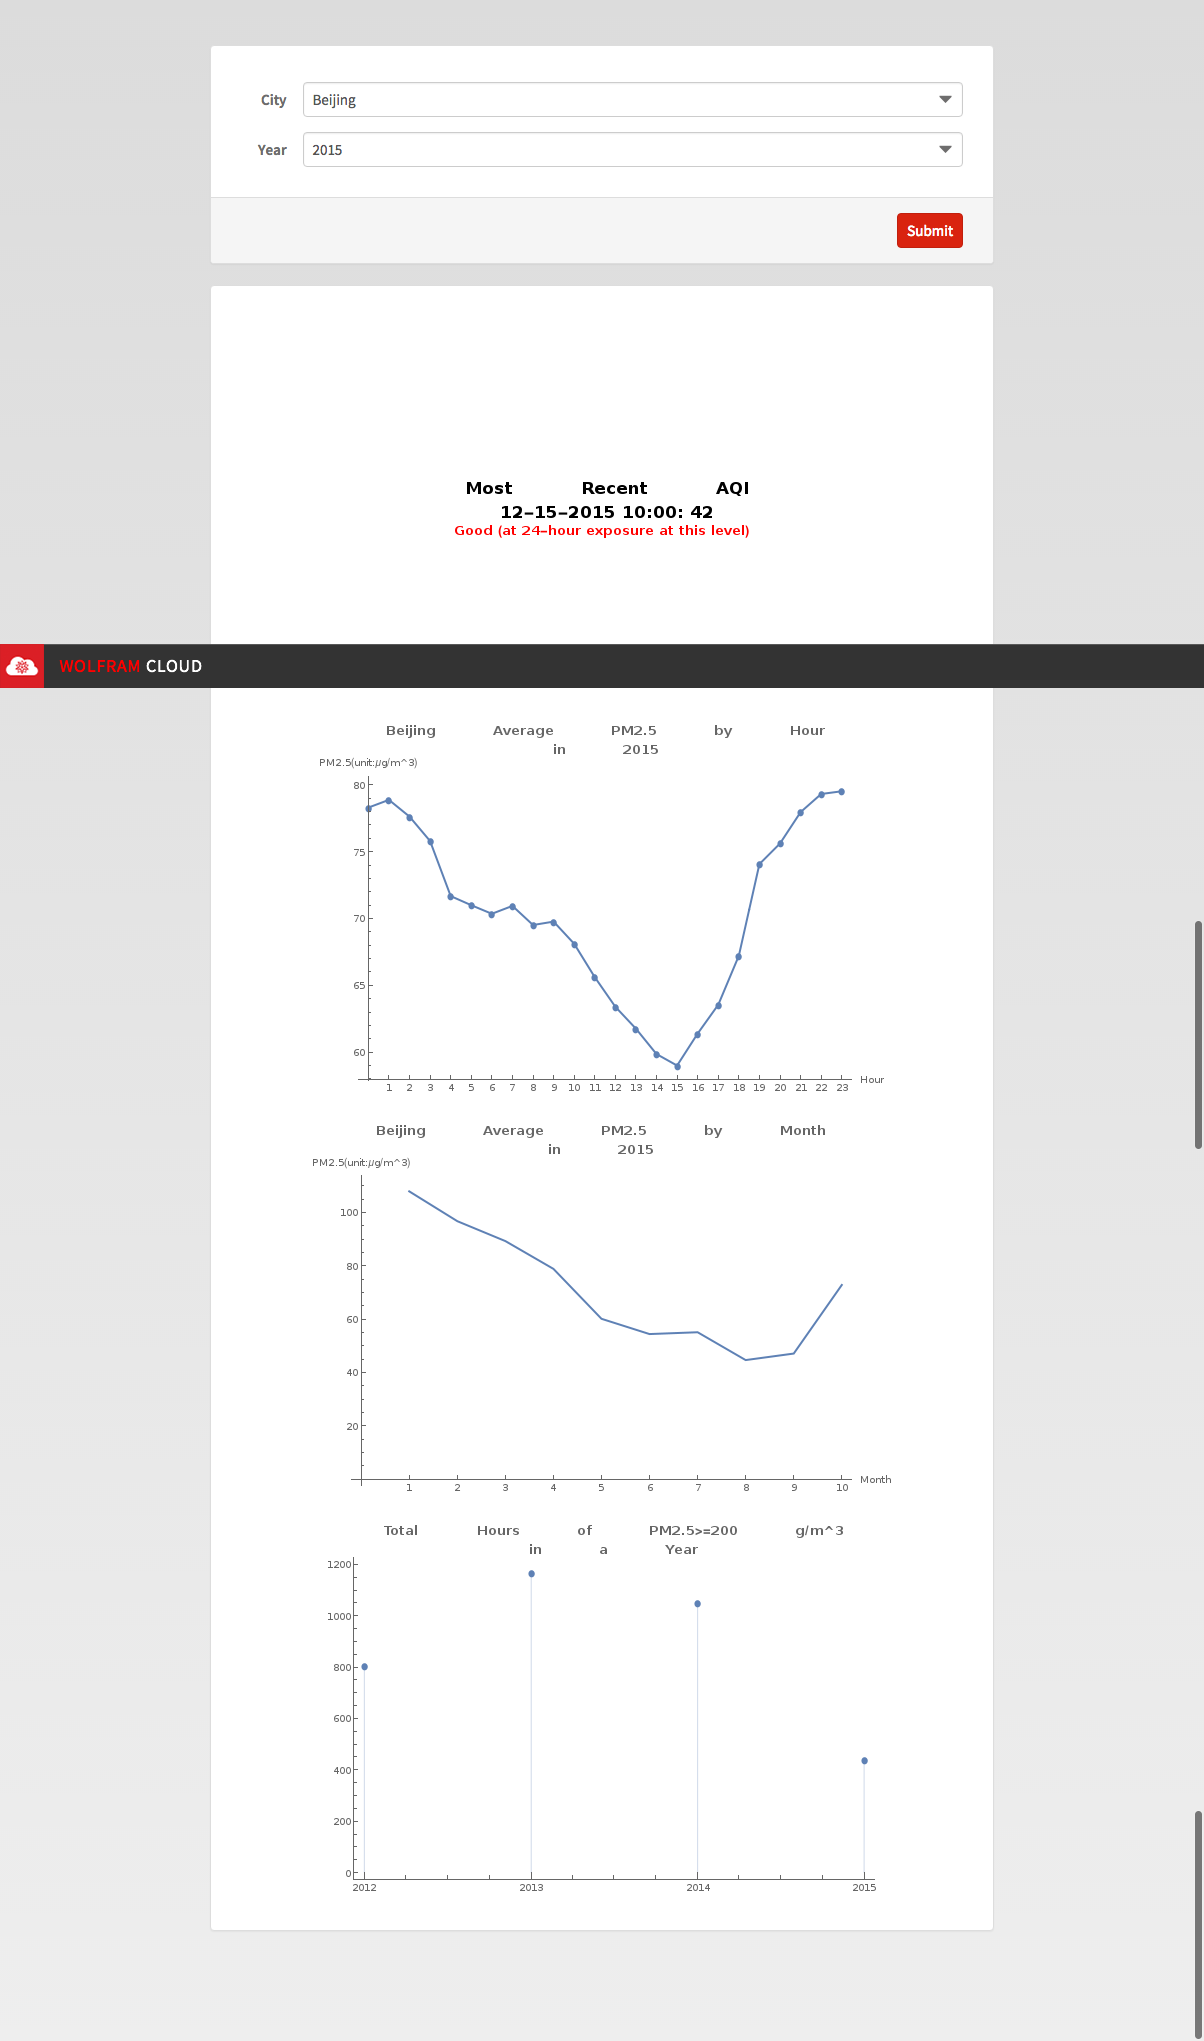
I found it odd that the spaces in the text I entered as plot label got trimmed in the cloud, so I have to explicitly use tab "\t" and new line "\n" to separate the words. This explains the odd display of some lines.

Attachments:
POSTED BY: Dan Lou
8 Replies

Hi Dan Lou,

I have a look at data for visualizing the bad hours. It seem most bad hours happened in bad season (winter).

enter image description here enter image description here

Attachments:
POSTED BY: Frederick Wu
Posted 9 years ago

@Frederick Wu :

Thank you for following up with such elegant code to show the big picture!

Sorry for my belated reply. I was not closely tracking down the discussion.

POSTED BY: Dan Lou

Hi Dan Lou,

Excellent job! In my opinion, the north of China (like Beijing and Shenyang), burn coal in winter. That makes the difference in season. For Shanghai, mainly problem may be the bad traffic. It caused pollution in rush hour.

Your last graphics “Total Hours of PM2 .5 >= 200 ?g/m3 in a Year” looks interesting. If we count every polluted hour, it looks 2015 is no clearly improved than 2014 and 2013. I suggest you can make this point more clearly or visualize it. When those polluted hour (PM2 .5 >= 200) will happened in every day through a month or a whole year?

If you haven’t watched this video, I recommend this for you. It's well-known speech in last year. She tries to search and explain many complex and complicated reasons behind air pollution in China. Chai Jing, Under the dome (????????).

Video Links:

http://www.donews.com/net/201503/2882208.shtm

http://edu.sina.com.cn/kids/2015-03-03/094887930.shtml

enter image description here enter image description here

POSTED BY: Frederick Wu
Posted 10 years ago

Hi @Sander Huisman , thank you for the comment. The air pollution in China is quite disturbing, especially for people who have been to China (I took a look at your blog, and BTW, I love the design as much as the content).

POSTED BY: Dan Lou

Hi Dan Lou,

very nice post. The issue of spaces within strings that are deleted in the cloud is known and has apparently been reported to developers.

Cheers,

Marco

POSTED BY: Marco Thiel

Thanks! When I was in Beijing it was not too bad (3 years ago) (even had a blue sky). But I saw some photos of last weeks, it looks very disturbing. I hope they find a solution soon!

POSTED BY: Sander Huisman
Posted 10 years ago

Thank you, @Marco Thiel . Glad to know the issue has already been reported.

POSTED BY: Dan Lou

Nicely made! And very worrying!!

POSTED BY: Sander Huisman
Reply to this discussion
Community posts can be styled and formatted using the Markdown syntax.
Reply Preview
Attachments
Remove
or Discard