Do All Roads Lead to Rome? The Answer is Surprisingly Beautiful by Gabrielle Bruney, is an interesting post that was recently published in theCreatorsproject blog. It shows the results of Moovel Lab's team (Benedikt Groß, Raphael Reimman and Philipp Schmitt), that visually proof the old saying that all roads lead to Rome. But Do All Roads Lead to Rome? The answer using the Wolfram Language and its newly built-in TravelDirections is surprisingly beautiful:
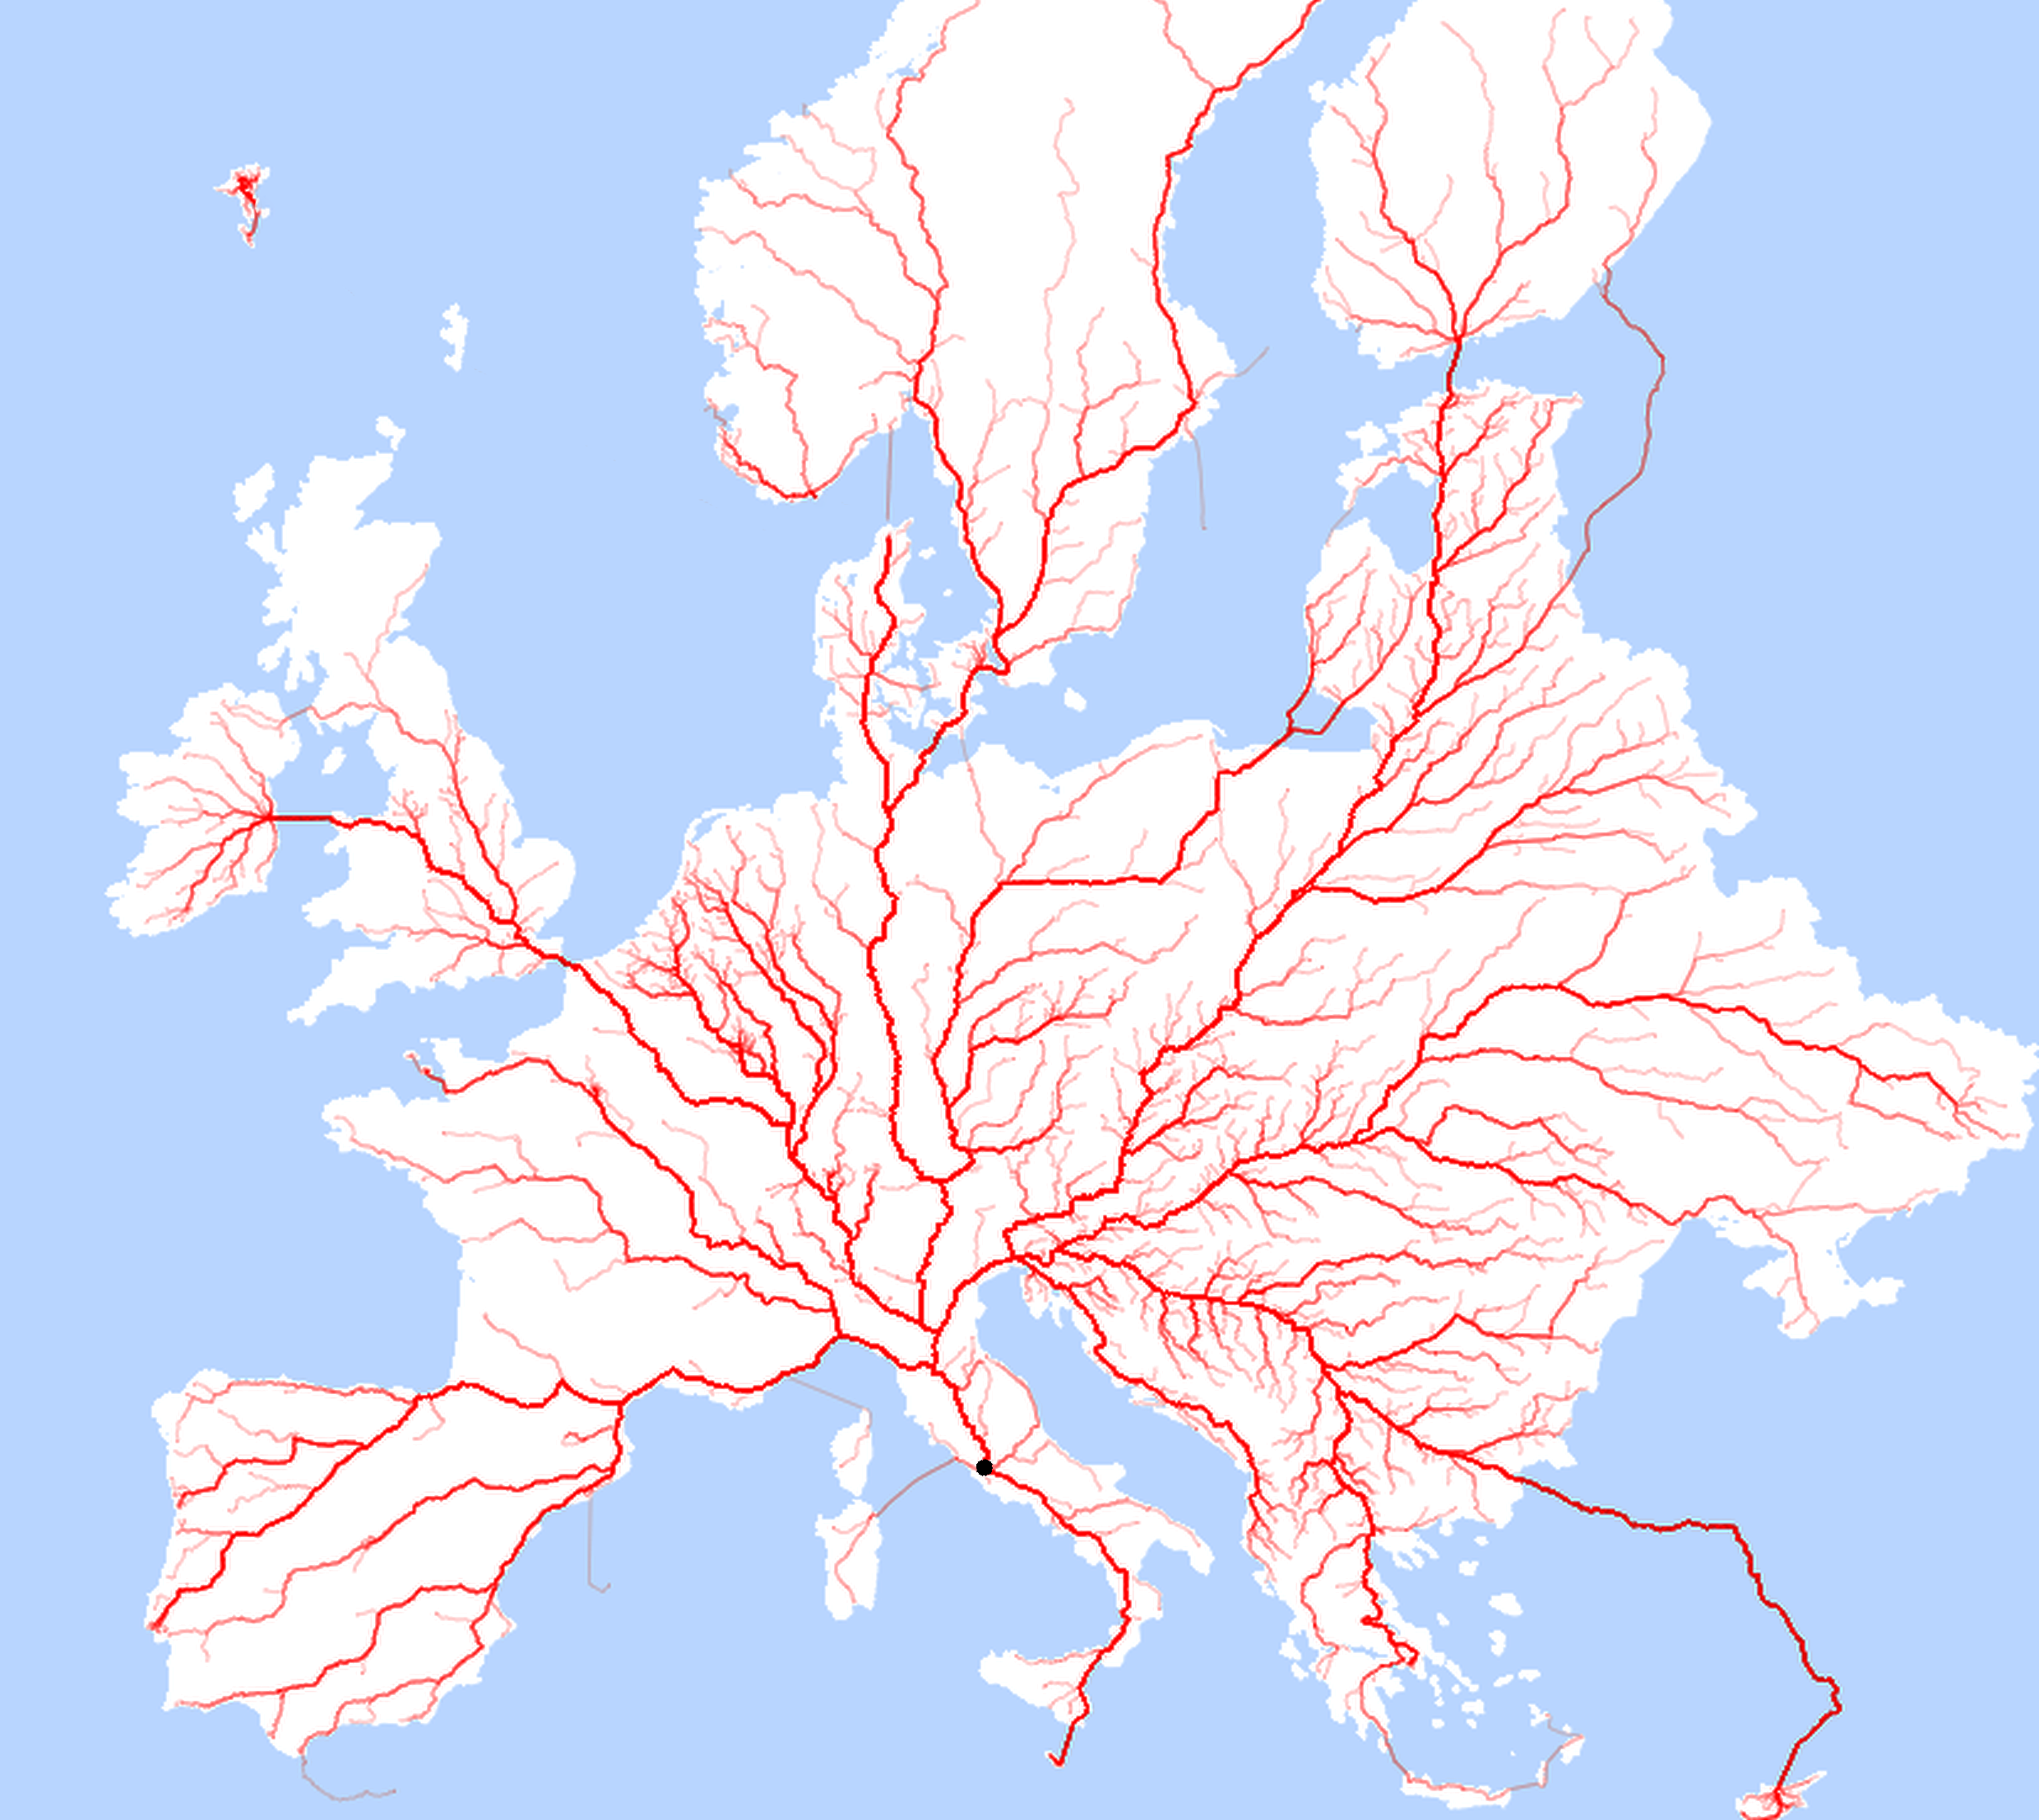
roadsToRome=ParallelMap[TravelDirections[{Entity["City",#],Entity["City", List["Rome", "Lazio", "Italy"]]},"TravelPath"]&,Flatten[CountryData["Europe","LargestCities"][[All,2]],1]];
roads=Select[roadsToRome,Head[#]==GeoPath&];
map=GeoGraphics[{GeoStyling[White],
EdgeForm[White],Polygon[EntityClass["Country", "Europe"]],
EdgeForm[],Polygon[EntityClass["Country", "Europe"]],Red,Opacity[.1],roads},GeoBackground->GeoStyling[LightBlue],GeoProjection->"Mercator",GeoRange->{{34.63,65.27},{-24.53,40.222}},ImageSize->1000];
Export["AllRoads2Rome.png",map]
Notice that I mapped over 30,000 large cities across Europe and the resulting GeoPath from each to Italys capital.
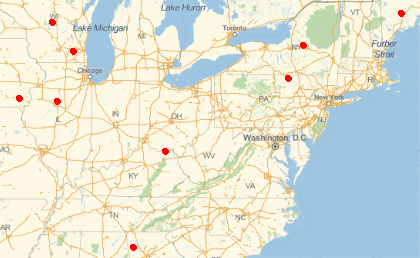
To generalize this to the whole World, just bear in mind that there are 10 cities called Rome in the US alone:
CityData["Rome"]
{ Entity["City",List["Rome","Lazio","Italy"]], Entity["City",List["Rome","Georgia","UnitedStates"]], Entity["City",List["Rome","NewYork","UnitedStates"]], Entity["City",List["Rome","Wisconsin","UnitedStates"]], Entity["City",List["Rome","Illinois","UnitedStates"]], Entity["City",List["Rome","Maine","UnitedStates"]], Entity["City",List["RomeJefferson","Wisconsin","UnitedStates"]], Entity["City",List["Rome","Pennsylvania","UnitedStates"]], Entity["City",List["Rome","Iowa","UnitedStates"]], Entity["City",List["Rome","Ohio","UnitedStates"]] }
GeoGraphics[{Red, PointSize[Large], Point[Drop[CityData["Rome"], 1]]}, GeoProjection -> "Mercator"]
Enjoy!


