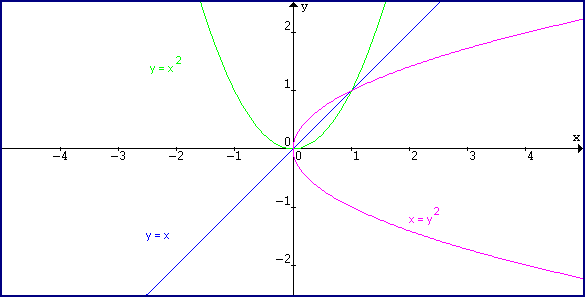
So, I'm trying to graph a parabola reflected across y=x.
y=x^2 --> y^2=x or y=Sqrt[x], yes?
Am I thinking about this correctly? It's been a long time...
So, I write:
Plot[{y = Sqrt[x]}, {x, 0, 50},
PlotRange -> {{0, 50}, {-7, 7}},
Ticks -> {{0, 5, 10, 15, 20, 25, 30, 35, 40, 45, 50}, {-6, -5, -4, -3, -2, -1, 0, 1, 2, 3, 4, 5, 6}}]
But, Mathematica only returns the portion of the graph above y=0. I'm not clear on why? Shouldn't it return +/- values and show both halves of the reflected parabola rather than only the top half? Does Sqrt[] only return positive values? Despite the fact that, say, (-2)(-2)=4 just as surely as 22=4?
Am I doing something wrong? Is it a problem with Mathematica? Am I thinking about it wrong? Can I force it to graph the entire thing (both positives and negatives, without having to graph them individually)? Is that even a legit thing to do?
I assume from images like these that it is, or should be?

 Attachments: