Group Abstract Group Abstract

Message Boards Message Boards

0
|
7.6K Views
|
7 Replies
|
2 Total Likes
View groups...
Share
Share this post:

How to limit the domain for the evaluation of NonlinearModelFit?

Posted 10 years ago

I am trying to fit some data using the NonlinearModelFit. z is the data from excel and s is the data after deleting the first row (containing headers). The data follows a log function. I want to use the form for f[t_]. When I run the code, I get the plots and the function that fits the data, but the data causes some issues because there are non-real numbers in the solution. Is there a way to limit the domain for the evaluation in which i know the values will all be real and positive?

z =  Import[indirname, {"Data", 1}];
s = Delete[z, 1];
f[t_] = a* Log[b + c*t];
nlm = NonlinearModelFit[s, f[t], {a, b, c}, t];

NonlinearModelFit::nrlnum: "The function value {35.2876 +22.2457\ I,33.9223 +22.2457\ I,32.5461 +22.2457\ I,32.0216 +22.2457\ I,<<16>>,29.8249 +22.2457\ I,29.7437 +22.2457\ I,29.8713 +22.2457\ I} is not a list of real numbers with dimensions {23} at {a,b,c} = {7.08102,-248.452,8.99277}."
POSTED BY: Alton Dugas
7 Replies
Posted 10 years ago

Using Bill Simpsons' starting values one can obtain values for all three parameters (along with an estimate of the mean square error).

s = {{10.7000, 0.2973}, {10.7333, 1.6486}, {10.7833, 3.0039}, {10.8167, 3.5144}, {10.8500, 3.8395},
{10.9000, 4.1202}, {10.9333, 4.2455}, {10.9667, 4.4361}, {11.0167, 4.5758}, {11.0500, 4.6816},
{11.0833, 4.7129}, {11.1333, 4.8043}, {11.1667, 4.9506}, {11.2000, 5.0406}, {11.2500, 5.0837},
{11.2833, 5.2404}, {11.3167, 5.2456}, {11.3667, 5.3305}, {11.4000, 5.3436}, {11.4333, 5.4154}, 
{11.4833, 5.4245}, {11.5167, 5.4911}, {11.5500, 5.3488}};

f[t_] = a*Log[b + c*t];
nlm = NonlinearModelFit[s, f[t], {{a, 1.25}, {b, -3100}, {c, 290}}, t]
nlm["BestFitParameters"]
(* {a\[Rule]1.1502828606882431`,b\[Rule]-1631.380481644411`,c -> 152.57998744295452`} *)
nlm["ParameterConfidenceIntervals"]
(* {{1.0474345664791553`,1.253131154897331`},
     {-2249.2467635975113`,-1013.5141996913108`},
     {94.83889289105193`,210.3210819948571`}} *)
nlm["CorrelationMatrix"]
(* {{1.`,0.9878056648705695`,-0.9878158479618072`},{0.9878056648705695`,1.`,-0.9999998678174467`},
     {-0.9878158479618071`,-0.9999998678174467`,1.0000000000000002`}} *)

One can see that the confidence intervals appear wide (at least to me) for the estimates of b and c and the correlations among the parameter estimators are extremely high. Those high correlations cause part of the reason as to why with this model and data, one needs to start close to the final values to obtain convergence.

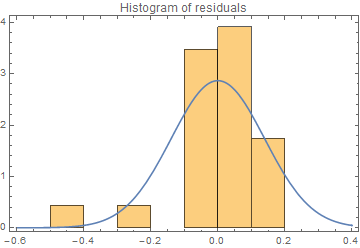
One should also always look at residual diagnostic plots to see if there's anything odd about the fit.

(* Get various quantities from the regression *)
residuals = nlm["FitResiduals"];
predicted = nlm["PredictedResponse"];
residMean = Mean[residuals];
residSD = StandardDeviation[residuals];

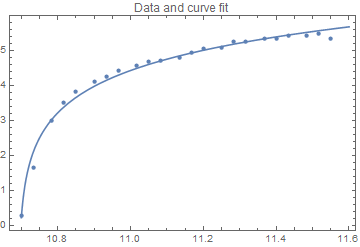
(* Data and curve fit *)
Show[{ListPlot[s], Plot[nlm[t], {t, 10.7, 11.6}]}, PlotRange -> All, PlotLabel -> "Data and curve fit", Frame -> True]

Data and curve fit

(* Histogram of residuals *)
Show[{Histogram[residuals, Automatic, "PDF"],
  Plot[PDF[NormalDistribution[residMean, residSD], x], {x, -0.6, 0.4}]}, 
  PlotRange -> All, PlotLabel -> "Histogram of residuals", Frame -> True, AxesOrigin -> {-0.6, 0}]

Histogram of residuals

(* Predicted vs. residual *)
ListPlot[Transpose[{predicted, residuals}], PlotLabel -> "Residuals vs. fitted values", Frame -> True]

Residuals vs fitted values

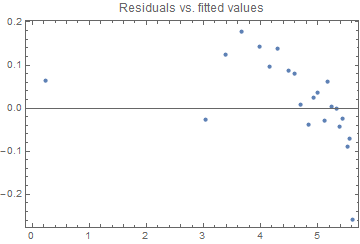
We see that there is a definite lack of fit based on the Residuals vs. fitted values figure. Maybe the theoretical curve needs additional parameters. Maybe there is serial correlation between neighboring measurements. But something you need to ascertain.

Finally a quantile plot is sometimes handy for seeing if the residuals are behaving as assumed:

(* Quantile plot *)
QuantilePlot[residuals, NormalDistribution[residMean, residSD], 
 PlotRange -> All, PlotLabel -> "Quantile plot", Frame -> True]

Quantile plot

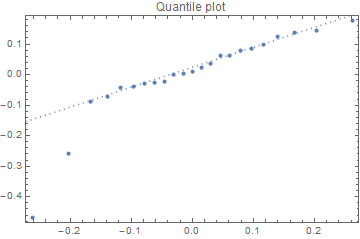
Here we see the first two observations deviate from the (dotted) line associated with a normal distribution. Maybe some transformation of the left and/or right side of the equation might be warranted.

POSTED BY: Jim Baldwin
Posted 10 years ago

Let's get some initial estimates for the parameters by exponentiating the vertical axis and doing a linear fit.

s = {{10.7000, 0.2973}, {10.7333, 1.6486}, {10.7833, 3.0039}, {10.8167, 3.5144}, {10.8500, 3.8395},
     {10.9000, 4.1202}, {10.9333, 4.2455}, {10.9667, 4.4361}, {11.0167, 4.5758}, {11.0500, 4.6816},
     {11.0833, 4.7129}, {11.1333, 4.8043}, {11.1667, 4.9506}, {11.2000, 5.0406}, {11.2500, 5.0837},
     {11.2833, 5.2404}, {11.3167, 5.2456}, {11.3667, 5.3305}, {11.4000, 5.3436}, {11.4333, 5.4154},
     {11.4833, 5.4245}, {11.5167, 5.4911}, {11.5500, 5.3488}};
exp = Map[{#[[1]], Exp[#[[2]]]} &, s];
line = Fit[exp, {1, t}, t]

Show[ListPlot[exp], Plot[line, {t, 10.7, 11.55}]]

which gives us -3100.3 + 290.013 t

and

enter image description here

Now, using those estimates for the parameters as starting values,

f[t_] := Log[b + c*t];
nlm = NonlinearModelFit[s, f[t], {{b, -3100}, {c, 290}}, t];
log = Normal[nlm]

Show[ListPlot[s], Plot[log, {t, 10.7, 11.55}]]

which gives us Log[-3031.56 + 283.439 t] without any error messages

and

enter image description here

POSTED BY: Bill Simpson
Posted 10 years ago

Thanks Bill. That does help. I've run into problems before with fitting data and I am trying to learn why some things work and some don't. I am new to Mathematica and would like to learn all the pitfalls, so when I present data, I can explain why certain procedures were used. Again, thanks for the help.

POSTED BY: Alton Dugas
Posted 10 years ago

thanks for looking.

POSTED BY: Alton Dugas
Posted 10 years ago

Sorry, I steered you wrong. The is almost certainly that some of the parameter guesses result in b + c t being less than zero (as that is inside a Log function). The parameters need to be restricted so that that doesn't happen.

POSTED BY: Jim Baldwin
Posted 10 years ago
{10.7000,   0.2973}, {10.7333, 1.6486}, {10.7833, 3.0039}, {10.8167, 3.5144},
{10.8500, 3.8395}, {10.9000,    4.1202}, {10.9333, 4.2455}, {10.9667,  4.4361}, 
{11.0167,   4.5758}, {11.0500, 4.6816}, {11.0833, 4.7129}, {11.1333,  4.8043}, 
{11.1667,   4.9506}, {11.2000,    5.0406}, {11.2500, 5.0837}, {11.2833,  5.2404},
{11.3167,   5.2456}, {11.3667,    5.3305}, {11.4000, 5.3436}, {11.4333,  5.4154}, 
{11.4833,   5.4245}, {11.5167,    5.4911}, {11.5500, 5.3488}
POSTED BY: Alton Dugas
Posted 10 years ago

It looks like the import did not work as desired as it looks like characters ("32.2876 +22.2457\I") rather than a numeric value. Can you show the first few values of z?

POSTED BY: Jim Baldwin
Reply to this discussion
Community posts can be styled and formatted using the Markdown syntax.
Reply Preview
Attachments
Remove
or Discard