Message Boards Message Boards

14
|
23967 Views
|
12 Replies
|
35 Total Likes
View groups...
Share
Share this post:

Visualizing digits of Pi with colored walks

Posted 11 years ago
Yesterday I came by an article “100 billion steps of Pi visualized”. Here are the rules for the visualization taken from the site:
This is a walk made out of the first 100 billion digits of pi in base 4 with the following rules for the steps: 0 right, 1 up, 2 left, 3 down. The color indicates the progress of the digits, starting at the color red. Goal of the image is to show that the digits of Pi are random and don't show any patterns.

This is based on original article “Walking on real numbers”. Well to compute 100 billion steps would require some time, but could we at least start this in Mathematica with maybe a jus few steps to see the result quickly?

Of course, but let’s try something new, why repeat things already done? So instead of base 4 we consider base 8. This will allow us to add steps in diagonal directions to those in vertical and horizontal directions. Define rules that will map a base-8 digit into a step in a particular direction, given by unit increments {dx, dy}:
rules = {0 -> {0, 1}, 1 -> {0, -1}, 2 -> {1, 0}, 3 -> {-1, 0}}~Join~(Rule @@@ Thread[{Range[4, 7], Tuples[{1, -1}, 2]}]);
Now define a function the uses this rules to make a step st from a given point pt:
onEsteP[pt_, st_] := pt + (st /. rules)
And now let’s walk on Pi !
ptsl = FoldList[onEsteP, {0, 0}, RealDigits[Pi, 8, 10^5][[1]]];
The last step of course to visualize it:
Graphics[MapIndexed[{Opacity[.5],
  ColorData["Rainbow"][#2[[1]]/Length[ptsl]], Line[#1]} &,
  Partition[ptsl, 2, 1]], Background -> Black]


And we can even create a scanning animation of a higher resolution image:
loi = Table[Graphics[MapIndexed[{Opacity[.5],
       ColorData["Rainbow"][#2[[1]]/Length[ptsl]], Line[#1]} &,
     Partition[ptsl, 2, 1]], Background -> Black,
    PlotRange -> {{0, 50} + k, {-150, -100}}], {k, 1, 50}];
Export["bmsf.gif", loi]

POSTED BY: Vitaliy Kaurov
12 Replies

enter image description here -- you have earned Featured Contributor Badge enter image description here Your exceptional post has been selected for our editorial column Staff Picks http://wolfr.am/StaffPicks and Your Profile is now distinguished by a Featured Contributor Badge and is displayed on the Featured Contributor Board. Thank you!

POSTED BY: Moderation Team
Bill, Not sure, but it could be that these rivers are higher densities of some light color.  Without the tooltips, it is something like this.
With[{n = 100}, Graphics[Table[{Hue[i/10],
Point[IntegerDigits[Position[RealDigits[Pi, 10, n^2][[1]], i][[All, 1]], n, 2]]}, {i, 0, 9}]]]
For comparison, here it is next to random numbers.  I think I see your rivers in both, but it seems like there are some qualitative differences which might be quantifiable.

POSTED BY: Todd Rowland
Vitaliy: "Hans, could you please post your code - the one that causes trouble to your system?"
It is identical to your code except that the 10^5 in ptsl = FoldList[onEsteP, {0, 0}, RealDigits[Pi, 8, 10^5][[1]]]; gets replaced with larger values. Having the front end crash as it tries to render a large graphic, or as it tries to save a notebook containing a large graphic, or as it tries to save a large graphic to (say) png, is not entirely unexpected. The Mathematica front end is one of the few applications on my system still 32-bit.
POSTED BY: Hans Havermann
Posted 11 years ago
I wrestled with trying to make the graphic you requested... and failed. I believe some or most of my problem was not being able to exactly reproduce the color palette they used or there may be something else in ArrayPlot makes the result appear different enough to ruin this.

If you go to http://two-n.com/pi  and click on the yellow text to get rid of that and you look from the left 1/4 the width of the box and 1/2 the height of the box from the top then at least my eyes see a light colored diagonal "river" going from the lower left to the upper right and perhaps 3 cm in length. Less than 1 cm above that there is a similar 2cm light colored river. 1/3 of the way from the left and 2/3 of the way from the top I see a steep negative slope river perhaps 4 cm long. At the top of that there is an intersecting 2 cm slightly positive slope river.

Squint your eyes a bit and look for lines or gradual arcs that are at least several cm (on my monitor) where there is a more or less uniform shift in color or brightness as you step across that line or arc.

I did have one idea if it were possible to squeeze out even an extremely tiny advantage by being able to identify and make use of even a few of these rivers.

To be clear to everyone, I have no delusions that I have discovered some deep pattern in the digits of pi which has eluded the brightest mathematical minds for centuries. 
POSTED BY: Bill Simpson
Bill,  Can you make a graphic highlighting the edges or ripples?  Even if it turns out to be just an artifact it'd still be cool.

According to Stephen Wolfram's "A New Kind of Science" p.138 regularity has never been found.  I suspect that there is some regularity out there in the digits of pi, and if it is ever found it will be done experimentally by "amateurs".

Note that there is a different sort of visualization type, with block sequences, which looks bland overall (see p.594 )   Also there is code in the notes for computing digits, and also skipping ahead to quickly compute the nth digit (in base 16) without computing the preceding digits.
POSTED BY: Todd Rowland
Posted 11 years ago
http://two-n.com/pi shows a different representation of the digits of pi as colored dots.
Note: If you click your mouse in the graphic and drag up or down you can see more digits.

You can see diagonal "edges" or ripples in the images that extend across hundreds of points.
I do realize this is just the eye and brain constructing patterns out of noise.
POSTED BY: Bill Simpson
Hans, could you please post your code - the one that causes trouble to your system?
POSTED BY: Vitaliy Kaurov
I'm playing with the original graphic: more terms, white background, different color gradients. The generation of the graphic is very memory intensive. If I try with more than 3*10^5 steps, Mathematica invariably crashes on my 32GB system. How might one insert plainly visible, regularly spaced (from initial to final) points?
POSTED BY: Hans Havermann
Excellent! You also could use splines for the camera path. And, well, if you wouldn't take every thousand point - it'd be one long journey ;)
POSTED BY: Vitaliy Kaurov
Posted 11 years ago
Neat!
I made a 3D walk by looking at the digits in base 6, here is a quick look at the first 10k steps:

 PiWalk3D[steps_: 10^5] := Block[{
    rules = {0 -> {0, 0, 1}, 1 -> {0, 0, -1}, 2 -> {0, 1, 0}, 3 -> {0, -1, 0}, 4 -> {1, 0, 0}, 5 -> {-1, 0, 0}},
    pts},
   pts = FoldList[#1 + (#2 /. rules) &, {0, 0, 0}, First@RealDigits[Pi, 6, steps]];
   Graphics3D[{
     Line[pts,
      VertexColors -> Array[ColorData["Rainbow"][#/Length[pts]] &, Length@pts]]
     },
    Boxed -> False, Background -> Black
   ]]

To create the gif I genereted the points in the walk and then interpolated a path between every thousand points. The camera was set to move along the path while looking at a point ahead.
flypts = pts[[1 ;; -1 ;; 1000]];
flypath = Interpolation[{Range@Length@flypts, flypts}//Transpose, InterpolationOrder -> 1];
frames = ParallelTable[
   Rasterize@Show[piwalk, ViewVector -> {flypath[t], flypath[t + 1]}],
   {t, 1,Length[flypts]-1, 0.1}];
Export["piwalk3d.gif", frames];
POSTED BY: Simon Schmidt
Very nice, Rodrigo. To keep color for splines you have to define it separately for each BSplineCurve, simalr to what I did in my code with Line. Sometnihg like:
MapIndexed[
{Opacity[.5], ColorData["Rainbow"][#2[[1]]/Length[points]], BSplineCurve[#1]} &,
  Partition[points, 2, 1]]
POSTED BY: Vitaliy Kaurov
(If you think that it should be a separeted post, tell me)
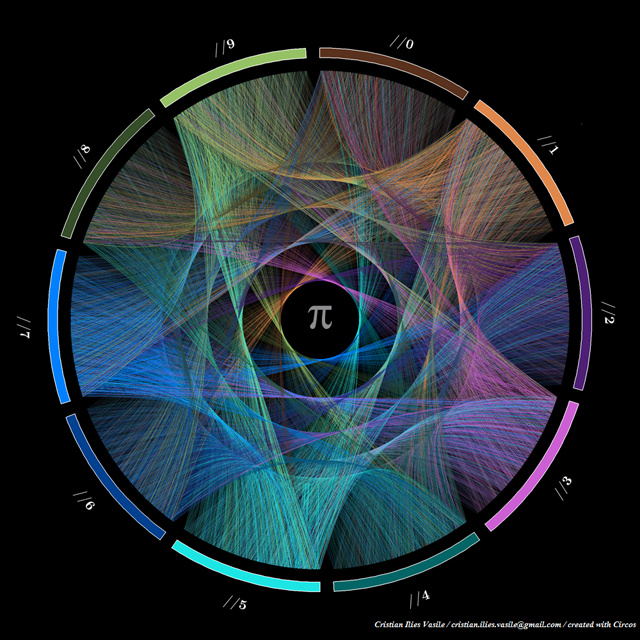
Nice post! I remembered this picture that I saw these days in the internet with 10.000 digits.


Trying to recriate it in Mathematica I did this:
 colors=Dispatch@Thread[Range[0,9]-> RGBColor@@@{{0.352941,0.188235,0.12549},{0.886275,0.537255,0.301961},{0.298039,0.121569,0.454902},{0.807843,0.388235,0.843137},{0.00784314,0.392157,0.403922},{0.0980392,0.890196,0.898039},{0.,0.243137,0.545098},{0.0196078,0.505882,1.},{0.211765,0.294118,0.164706},{0.588235,0.760784,0.411765}}];
 Clear@inc
 qtdDigits=1000;
 SetAttributes[inc,Listable]
 Scan[(val[#]=#)&,Range[0,9]]
 inc[digit_]:=val[digit]+=1/(qtdDigits/5.)
 piDigits=RealDigits@N[\[Pi],qtdDigits]//First;
 points=inc@piDigits;
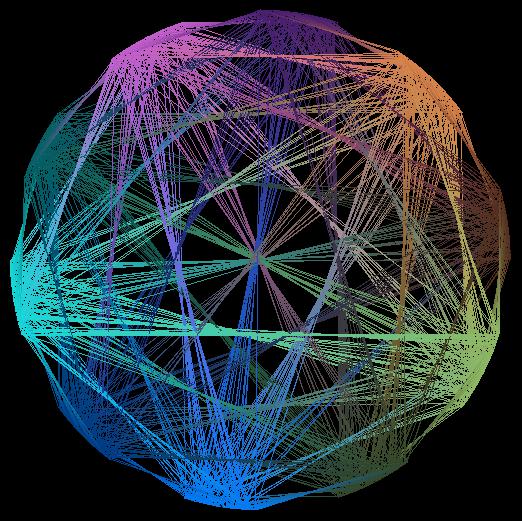
 Graphics[{White,Opacity[0.95],Thickness[0.001],Line[Table[{Cos[t],Sin[t]},{t,2\[Pi] points/10}],VertexColors->piDigits/.colors]}
         ,Background->Black
]
And get as result this:

Now I tried to use BSplineCurve to get curved lines, but I lost the colors blend between the numbers connections.
 colors=Dispatch@Thread[Range[0,9]-> RGBColor@@@{{0.352941,0.188235,0.12549},{0.886275,0.537255,0.301961},{0.298039,0.121569,0.454902},{0.807843,0.388235,0.843137},{0.00784314,0.392157,0.403922},{0.0980392,0.890196,0.898039},{0.,0.243137,0.545098},{0.0196078,0.505882,1.},{0.211765,0.294118,0.164706},{0.588235,0.760784,0.411765}}];
 Clear@inc
 qtdDigits=1000;
 SetAttributes[inc,Listable]
 Scan[(val[#]=#)&,Range[0,9]]
 inc[digit_]:=val[digit]+=1/(qtdDigits/5.)
 piDigits=RealDigits@N[\[Pi],qtdDigits]//First;
 points=Table[{Cos[t],Sin[t]},{t,2\[Pi] inc@piDigits/10}];
 Graphics[{White,Opacity[0.95],Thickness[0.001],BSplineCurve[{#1,{0,0},#2}]&@@@Partition[points,2,1]},Background->Black]


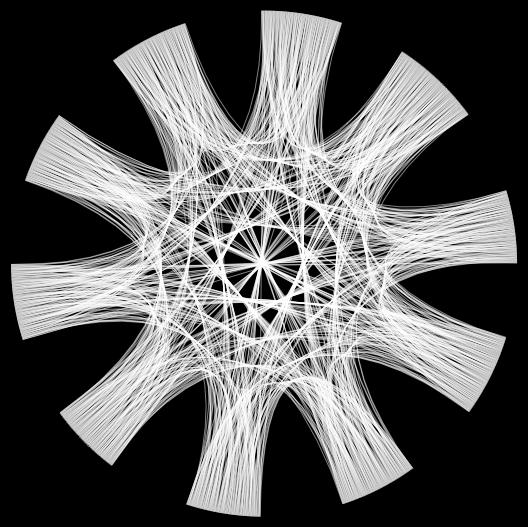
Some clue on how can I have color blend on that? Con you improve it?
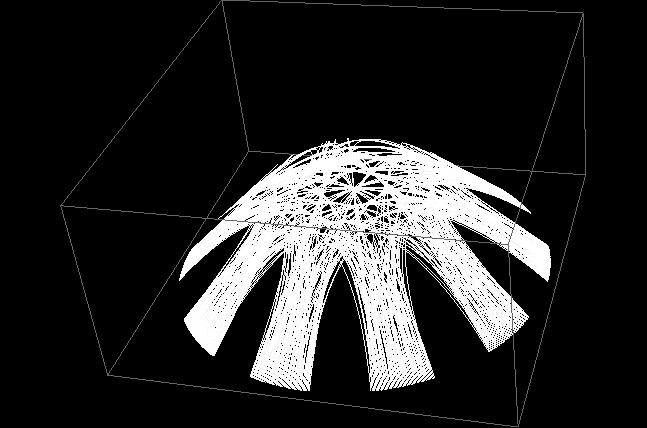
I also liked this 3D version that look like a cabana.

POSTED BY: Rodrigo Murta
Reply to this discussion
Community posts can be styled and formatted using the Markdown syntax.
Reply Preview
Attachments
Remove
or Discard

Group Abstract Group Abstract