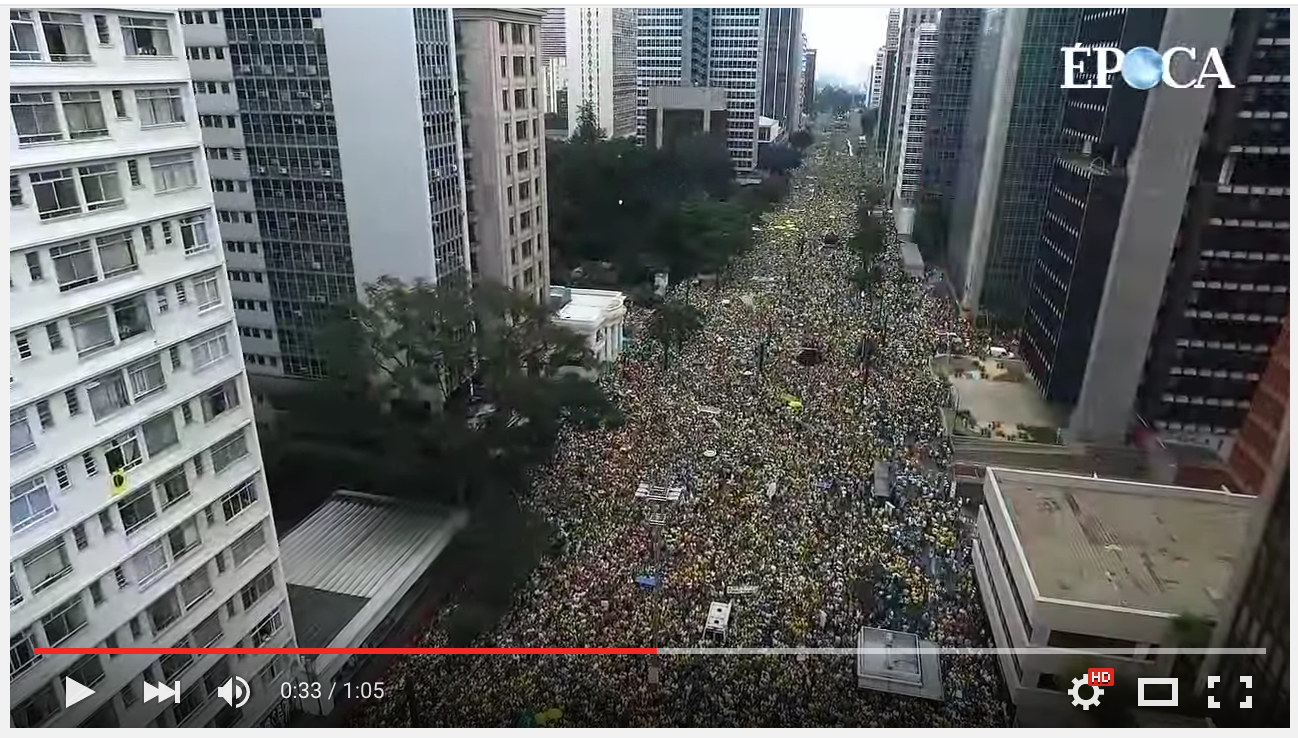
Last weekend, 16th march 2016, we had the biggest protests ever registered here in Brasil against a Government.
In TV, for each city, we always see three numbers for protesters count. The organizer's number, the police number and an institute number, and they always show completely discrepant results. As you can see, for Av. Paulista in São Paulo we have.
- Organizer's number: ...2.5 millions
- Polices's number:....... 1.4 millions
- Datafolha's number: ...0.5 millions
From 33' to 36' seconds of this video we can see the image of people in the streets.
The challenge is: Can I count them with Mathematica and help the Brazilian democracy to be a bit more precise?
Here is my humble wrong attempt to do it:
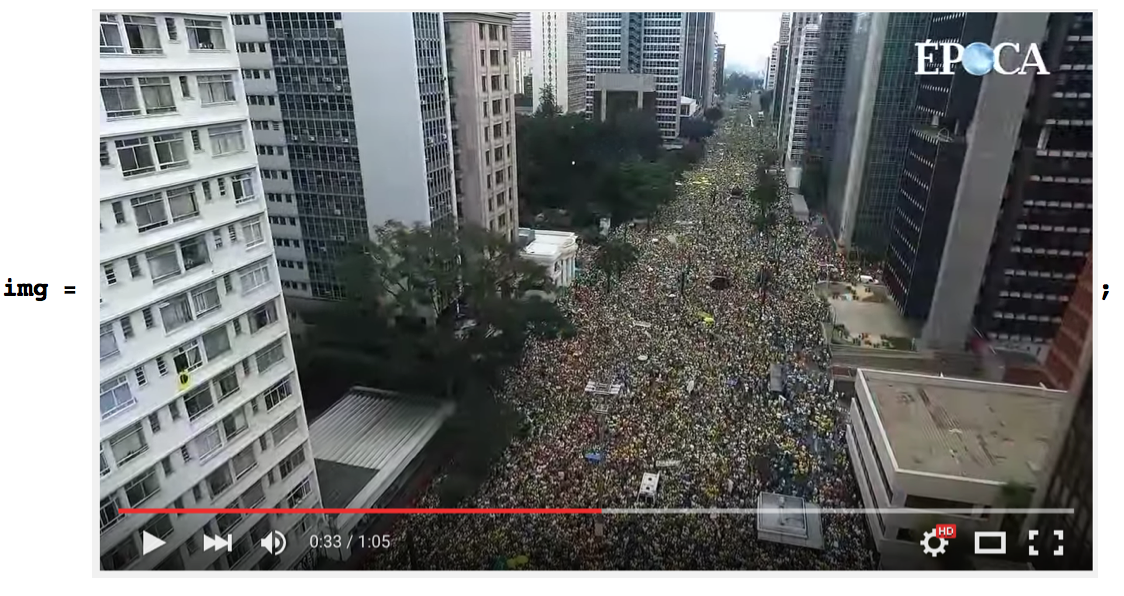
img = Binarize[img];
m = ImageDifference[DeleteSmallComponents[img, 20], img];
(m =  MorphologicalComponents[m])// Colorize
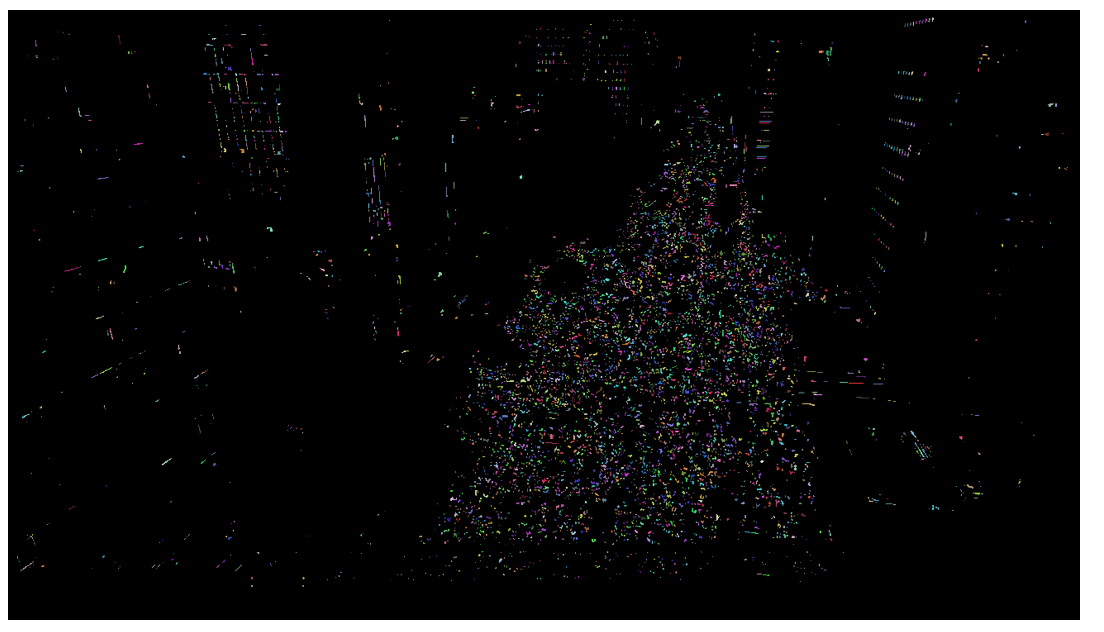
Length@ComponentMeasurements[m,"Count"]
(*4953*)
So I get the worst estimative ever! How can this be improved?
UPDATE
A better approach: Inspired by this post
pts = 200{{0,0},{0,1},{1,1},{1,0}};
width=100;
height=100;
ptsFlat={{0,0},{width,0},{width,height},{0,height}};
LocatorPane[Dynamic[pts],
  Dynamic[
  {err,transform} = FindGeometricTransform[pts,ptsFlat,TransformationClass->"Perspective"];
  grid = Table[transform[{x,y}],{x,0,width,5},{y,0,height,5}];
   Show[img,
     Graphics[{
       {EdgeForm[Red], Transparent, Polygon[pts]},
       {Red, MapIndexed[Text[Style[#2[[1]], 14], #1, {1, 1}] &, pts]},
       {Red,Line/@grid,Line/@Transpose[grid]}
     }], ImageSize-> 500
    ]
  ]
]
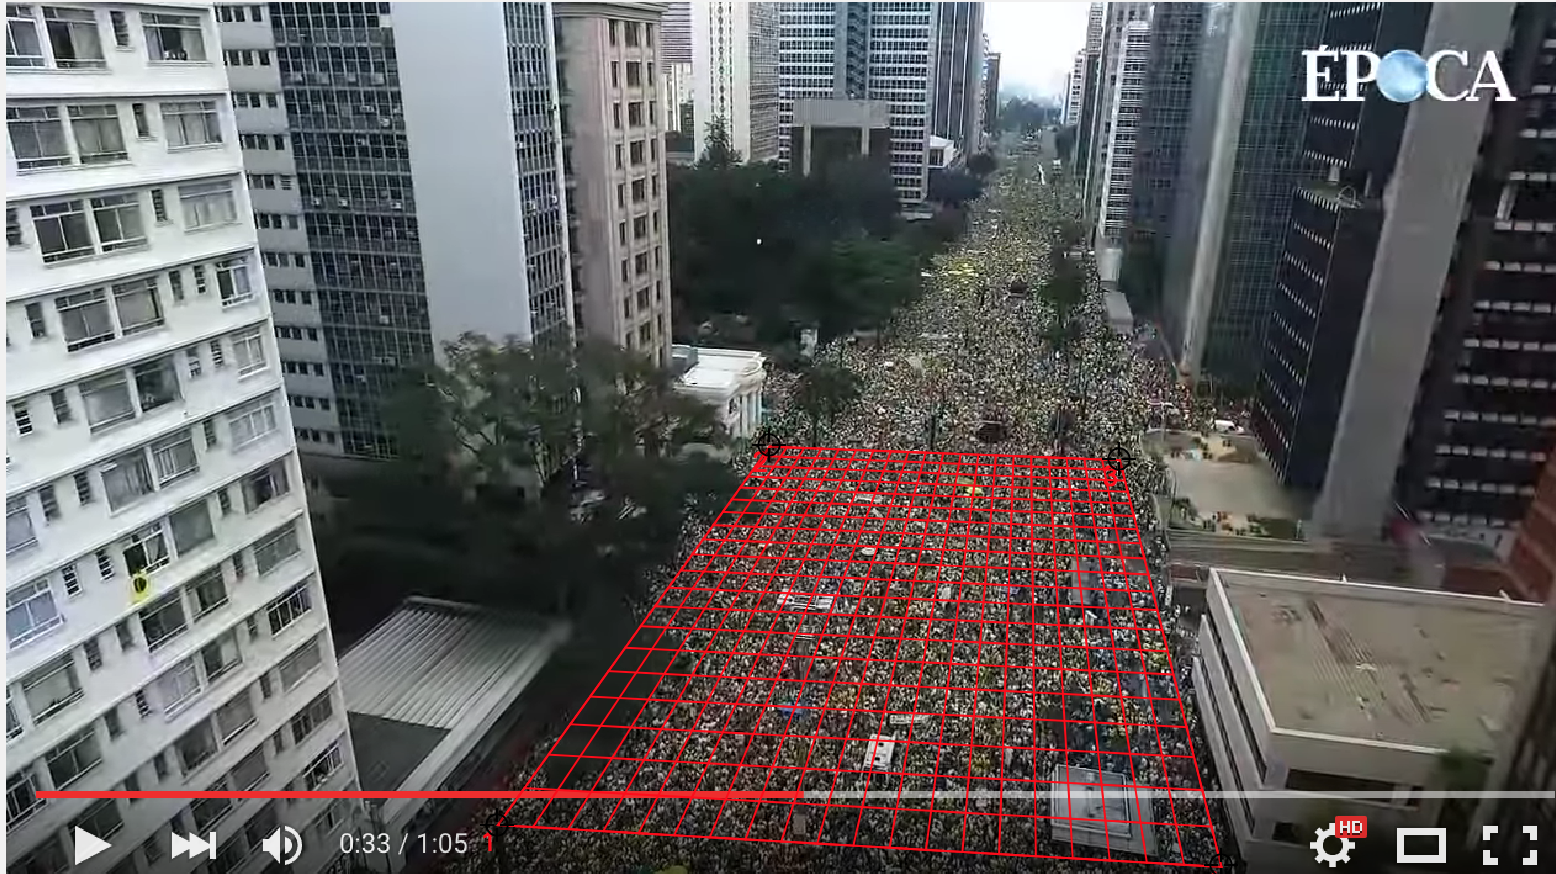
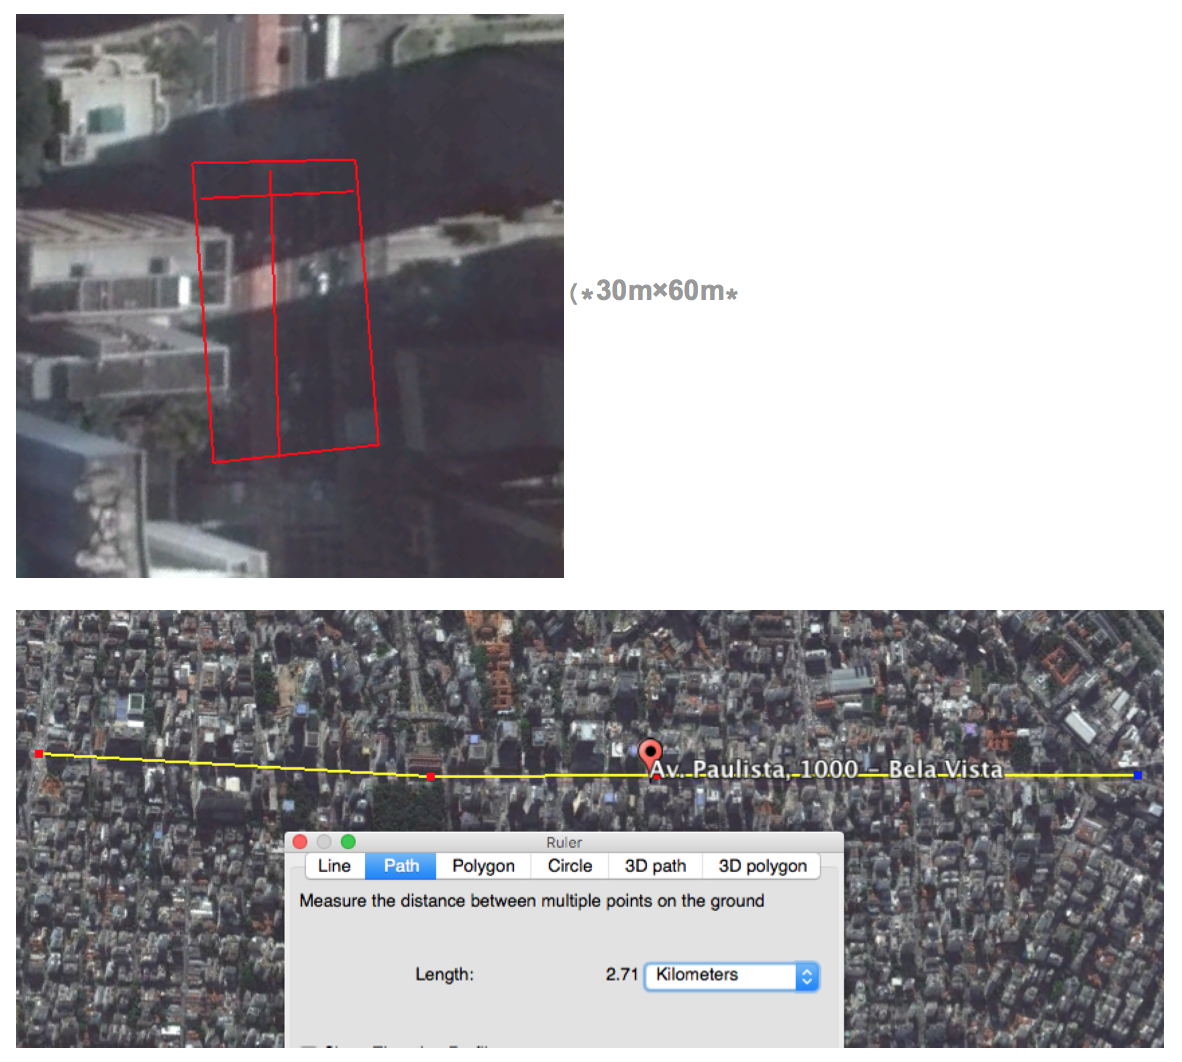
Using: 10 people per square, we get: (400 x 10/60) x 2710 = 180k


