Hi Roger,
no that's to part of DateListPlot. Your data after import has these dimensions:
data // Dimensions
(*{1, 21579, 5}*)
That means that it is a list of 21579 lists of five entries. The outer list (corresponding to the 1) comes from the excel spreadsheet. Sometimes these things have multiple pages, but yours doesn't. If I now print out a couple of days it looks like that:
data[[1, 1 ;; 10]] // TableForm
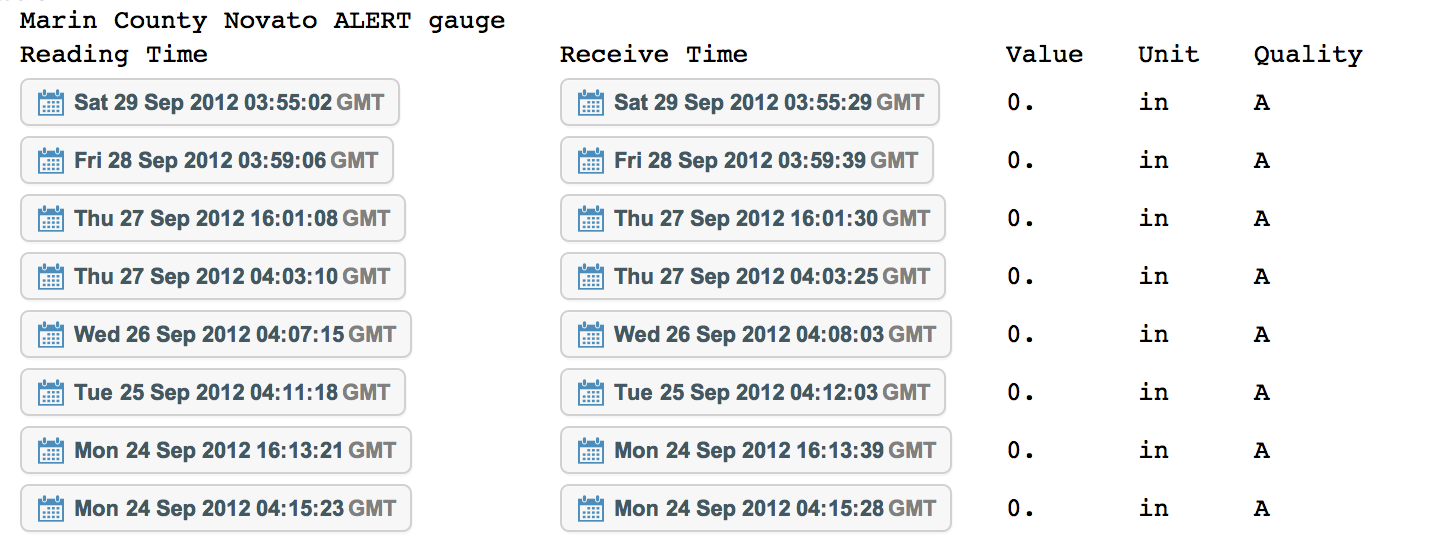
As you see the first two rows are just headers and I don't want to plot them. so I only choose the one from 3 to the end. So if I write:
data[[1,3;;]]
that mans take the fist (and only) page of the spreadsheet. Then use rows 3 to the end. If I knew that there are 21579 lines I could also write
data[[1,3;;21579]]
but you see that the the first choice is somewhat shorter and requires less knowledge. It just means take rows 3 to the end. The table also shows that per row there are five entries. I was interested in the first and the third. That is where the {1,3} comes from.
Ok. Once we have done this we can do:
ts = TimeSeries[data[[1, 3 ;;, {1, 3}]]];
rainperday = MovingMap[Total, ts, Quantity[1, "Days"]];
DateListPlot[rainperday]
to get
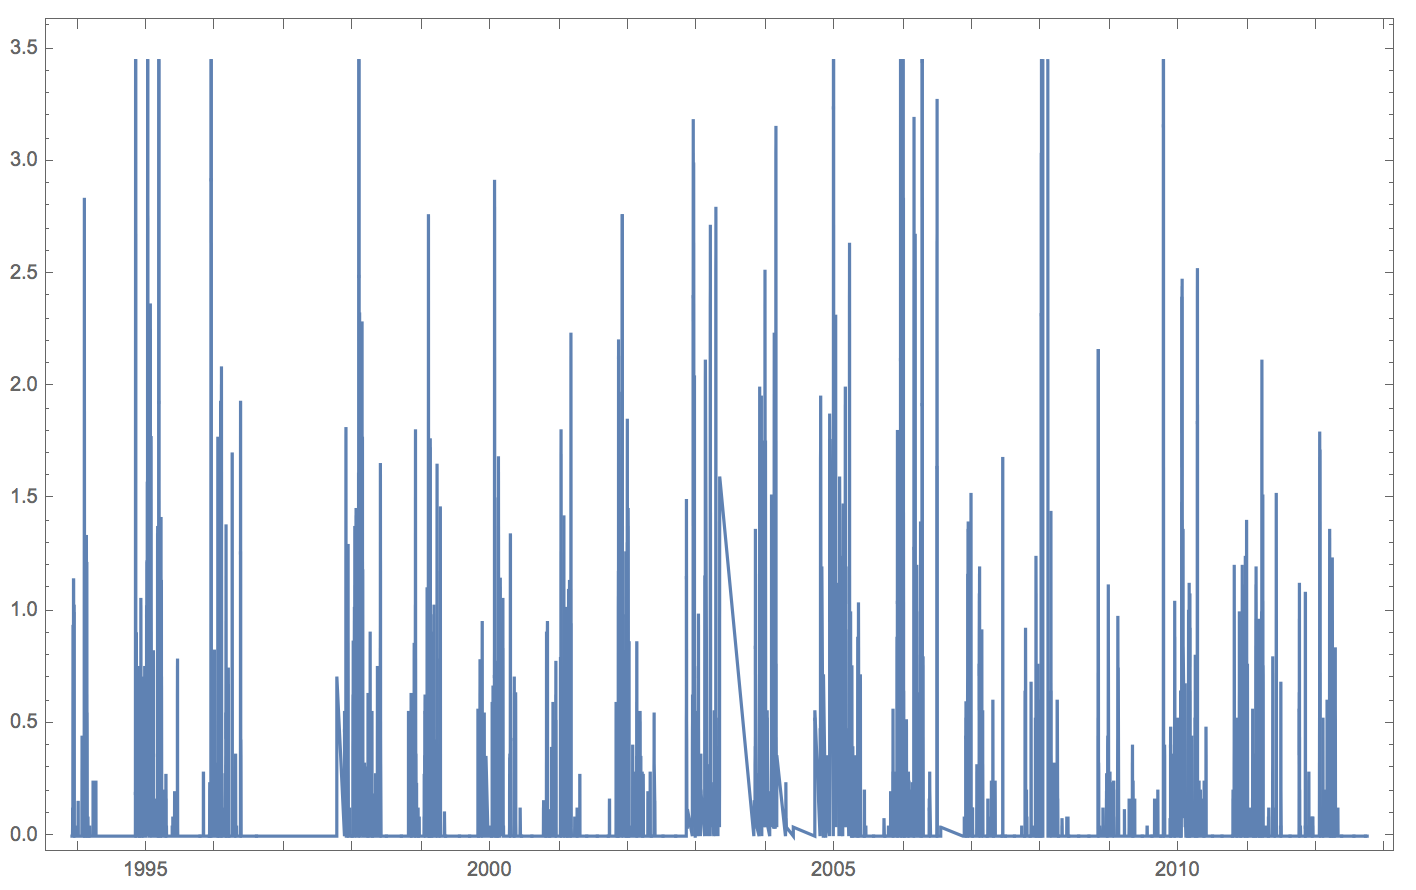
It is easy to see that Mathematica cuts off at about 3.5 so that most of the time series can easily be seen. But you can force it to plot everything:
DateListPlot[rainperday, PlotRange -> All]
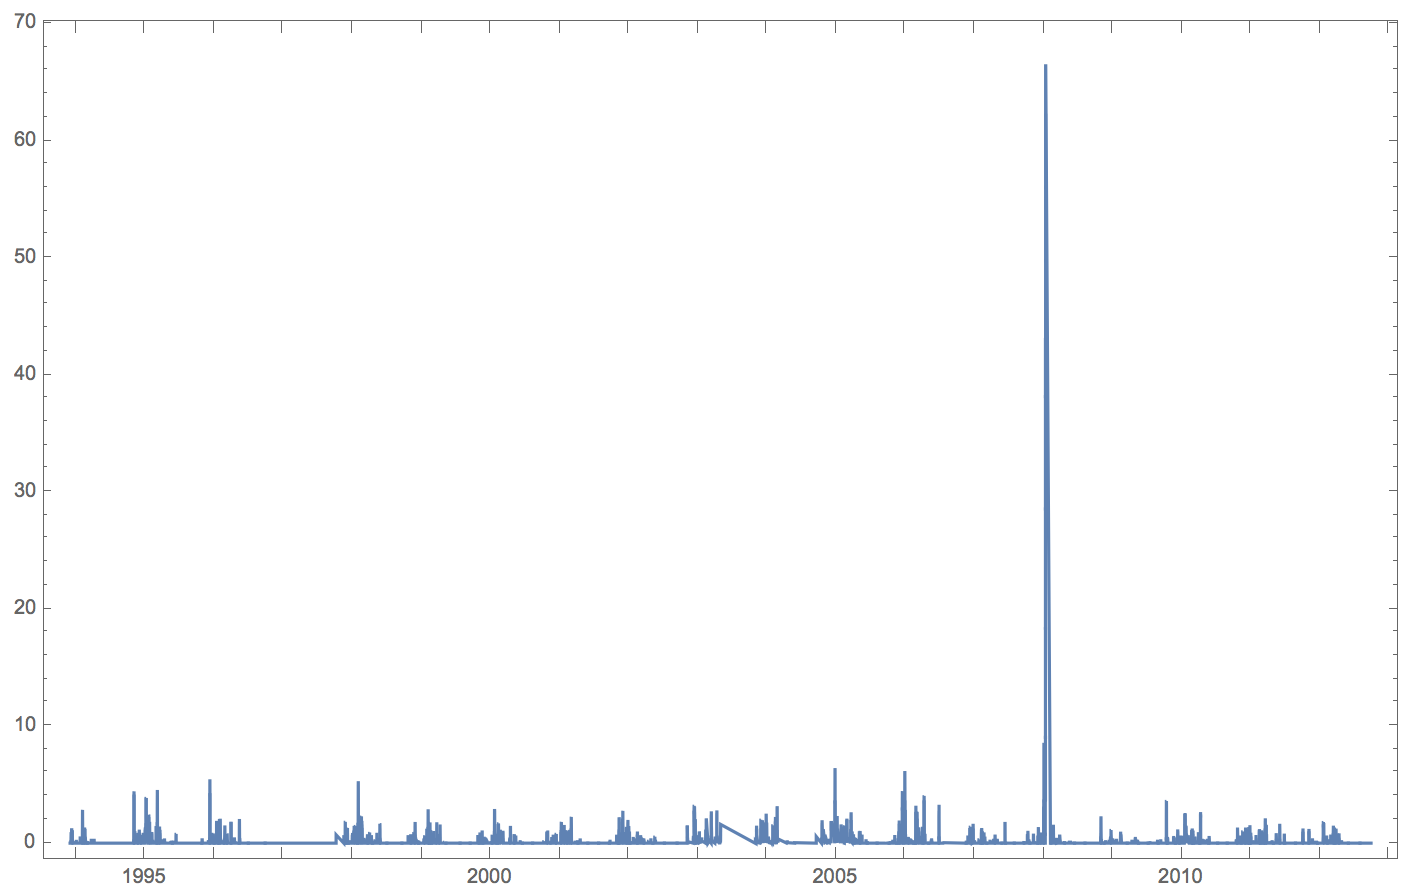
There is obviously a very large peak at the beginning of 2008 (3rd January?). Given your geolocation, I assume that this is the January 2008 North American storm complex, but that's only a guess. An alternative explanation would be that somebody sprayed it with a watering hose.
It is a beautiful dataset. It could be a challenge for this community to find out where your rain gauge probably was - that can of course only be done with quite some error, but it would be fun...
Cheers,
Marco


