Message Boards Message Boards

2
|
6987 Views
|
2 Replies
|
6 Total Likes
View groups...
Share
Share this post:

Character frequency in your code

Posted 9 years ago

I was asked earlier how many closing brackets in a row I'd written in Mathematica. The challenger presented a the end of a line with a hefty ten consecutive brackets, closing functions, array references, and lists.

I did not know if I'd beaten ten. I could spot fives and sixes in my open document, but not much higher...

I wrote some code to import the plaintext of my 'archive' folder, which contains a lot of notebooks, and answer the question for me. The results of naive character tallying across notebooks are quite interesting. for example I (somewhere) have six sets of unclosed square brackets, representing a 0.005% square bracket closing failure rate! I didn't manage to beat or match 10 brackets, but I've used a string of nine brackets on twelve occasions.

bracket string length

Pictured above: The occurrence of strings of bracket characters in my notebooks.

Pictured below: The occurrence of different individual characters in my notebooks. (Open image separately for higher resolution)

character frequency

I'd be interested to hear these arbitrary measures for other peoples old notebooks. Can you differentiate peoples coding styles from such simple metrics I wonder. Notebook attached (you'll need to specify a directory containing notebooks to run it on).

Attachments:
POSTED BY: David Gathercole
2 Replies

Bedford's law relates to the distribution of leading digits in data. I was too lazy to reprogram David's program to look for leading digits, but I still wanted to see how well the digits in my codes correspond to Benford's law. I need to only look at digits in my code (instead of all characters, like David does) and then remove the zeros - as they are ignored as leading characters in Benford's law. Here's the result:

Show[DiscretePlot[
PDF[BenfordDistribution[10], x] // Evaluate, {x, 1, 9}, 
PlotMarkers -> Directive[Red, Automatic], 
PlotRange -> {{1, 9}, {0, 0.35}}], 
ListLinePlot[
ToExpression@
Sort@Select[
SortBy[{#[[1]], 
N@#[[2]]/
Total[Select[
SortBy[{#[[1, 1]], Total[#[[;; , 2]]]} & /@ 
SplitBy[
Sort[Flatten[#[[2]] & /@ # & /@ data, 
2]], #[[1]] &], #[[2]] &], 
MemberQ[CharacterRange["1", "9"], #[[1]]] &][[All, 
2]]]} & /@ 
Select[SortBy[{#[[1, 1]], Total[#[[;; , 2]]]} & /@ 
SplitBy[Sort[
Flatten[#[[2]] & /@ # & /@ data, 
2]], #[[1]] &], #[[2]] &], 
MemberQ[CharacterRange["1", "9"], #[[1]]] &], #[[2]] &], 
MemberQ[CharacterRange["1", "9"], #[[1]]] &], PlotRange -> All]]
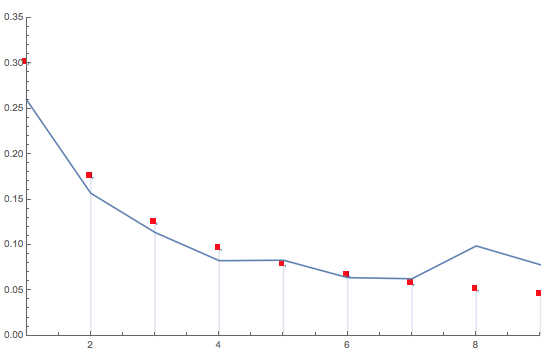
enter image description here

Of course, this data set does not really fit the Benford distribution:

datasymbols = 
  ConstantArray[#[[1]], Floor[#[[2]]]] & /@ (ToExpression@
     Sort@Select[
       SortBy[{#[[1]], N@#[[2]]} & /@ 
         Select[SortBy[{#[[1, 1]], Total[#[[;; , 2]]]} & /@ 
            SplitBy[
             Sort[Flatten[#[[2]] & /@ # & /@ data, 
               2]], #[[1]] &], #[[2]] &], 
          MemberQ[CharacterRange["1", "9"], #[[1]]] &], #[[2]] &], 
       MemberQ[CharacterRange["1", "9"], #[[1]]] &]);
DistributionFitTest[RandomChoice[Flatten[datasymbols], 1000], 
 BenfordDistribution[10], "TestConclusion"]

which gives a rejection:

enter image description here

Ok, that is not really doing proper statistics on these numbers, but just playing a bit.

Cheers, Marco

POSTED BY: Marco Thiel

Marco has sent me his character frequency plot:

marco freq

We can quite easily take the frequency rank from the axis of this plot, and so compare the frequency of characters in our code.

comparison

Here my characters are bellow the diagonal, and Marco's above, showing I use several non numeric characters in preference.

POSTED BY: David Gathercole
Reply to this discussion
Community posts can be styled and formatted using the Markdown syntax.
Reply Preview
Attachments
Remove
or Discard

Group Abstract Group Abstract