Message Boards Message Boards

0
|
12004 Views
|
10 Replies
|
3 Total Likes
View groups...
Share
Share this post:

Finding Peaks with Signal Data

Posted 9 years ago

Hi All,

I have a question regarding FindingPeaks with Signal Data in ListLinePlot. I have two columns with data and am trying to find the Peaks of the second column (the first column are the x-data in seconds). The outcome of the number of peaks are = 32, but only 1 peak showed on the plot at 1 second. What is wrong? Please can you help?enter image description here

See file attached. Thanks.

data=test[[All,2]]; peaks=FindPeaks[data];First/@peaks;Length[peaks]; ListLinePLot[test,Epilog->{Red,PointSize[0.03],Point[peaks]},PlotStyle->Directive[Green,Thin]}]
Attachments:
POSTED BY: Jos Klaps
10 Replies

No need for real-time output. All of this analysis is after-the-fact regarding a plant upset.

POSTED BY: Richard Klopp

Marco Thank you, this is extremely helpful. Funny you mention over-sampled. You should see the original data, which is sampled 12 times even more frequently. This is telemetry data from a large machine, and high-frequency sampling is required to resolve certain mechanical responses, but certainly not thermal responses. The data example I supplied here is an example of a thermal response. Kindest regards,

Rich

POSTED BY: Richard Klopp

Dear Richard,

that is indeed, interesting. And the mechanical responses might be on a much faster time scale than the thermal ones. A long time ago I looked at data from milling and had rather high resolution measurements. I believe that Mathematica should be able to deal with this kind of data. (You might use alternatives to the Import function though...)

Do you need the results in (near) real-time?

Best wishes,

Marco

POSTED BY: Marco Thiel

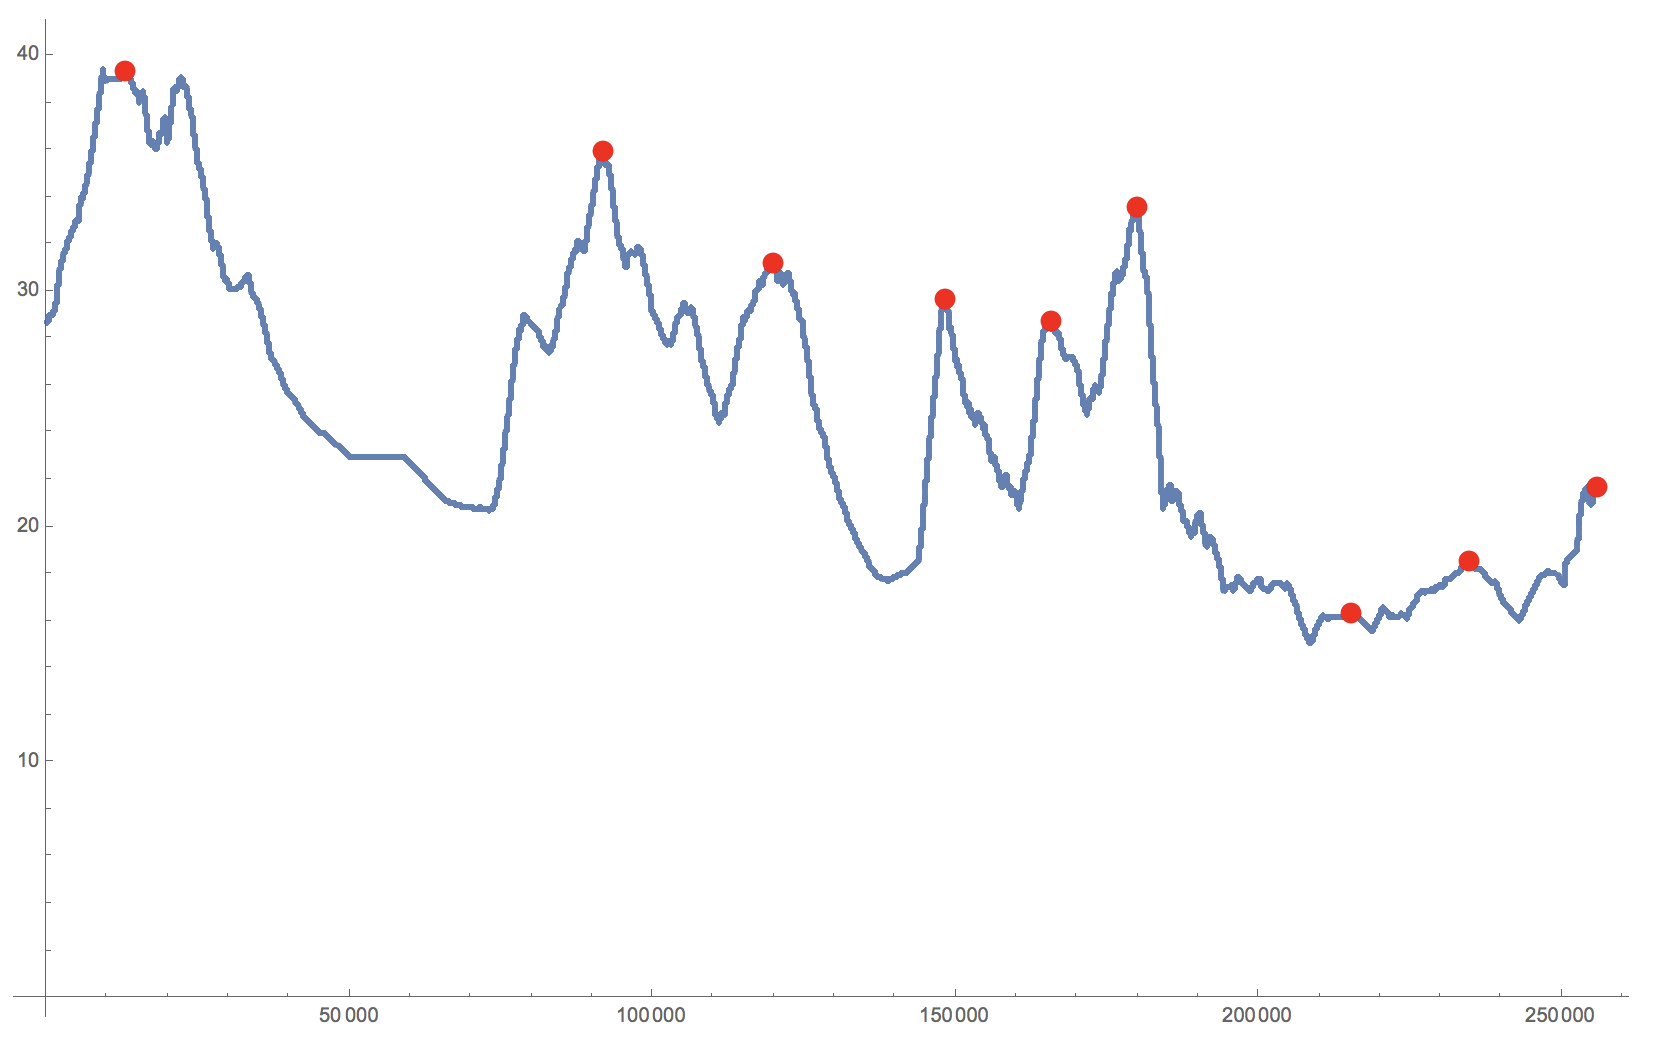
Another thing is that the time series appears to be hopelessly oversampled. Everything becomes much faster if you first resample:

Show[ListLinePlot[MovingAverage[ArrayResample[testData, 2500], 50]], 
 ListPlot[FindPeaks[MovingAverage[ArrayResample[testData, 2500], 50], 25], PlotStyle -> Red]]

enter image description here

One can put a bit more effort (calculate window sizes in the resampled data) into this, but basically one can then also determine where the peaks are for the original sampling:

peaksresample = N /@ FindPeaks[MovingAverage[ArrayResample[testData, 2500], 50], 25];
{Length[testData]/2500.*#[[1]], #[[2]]} & /@ peaksresample

Cheers,

Marco

POSTED BY: Marco Thiel

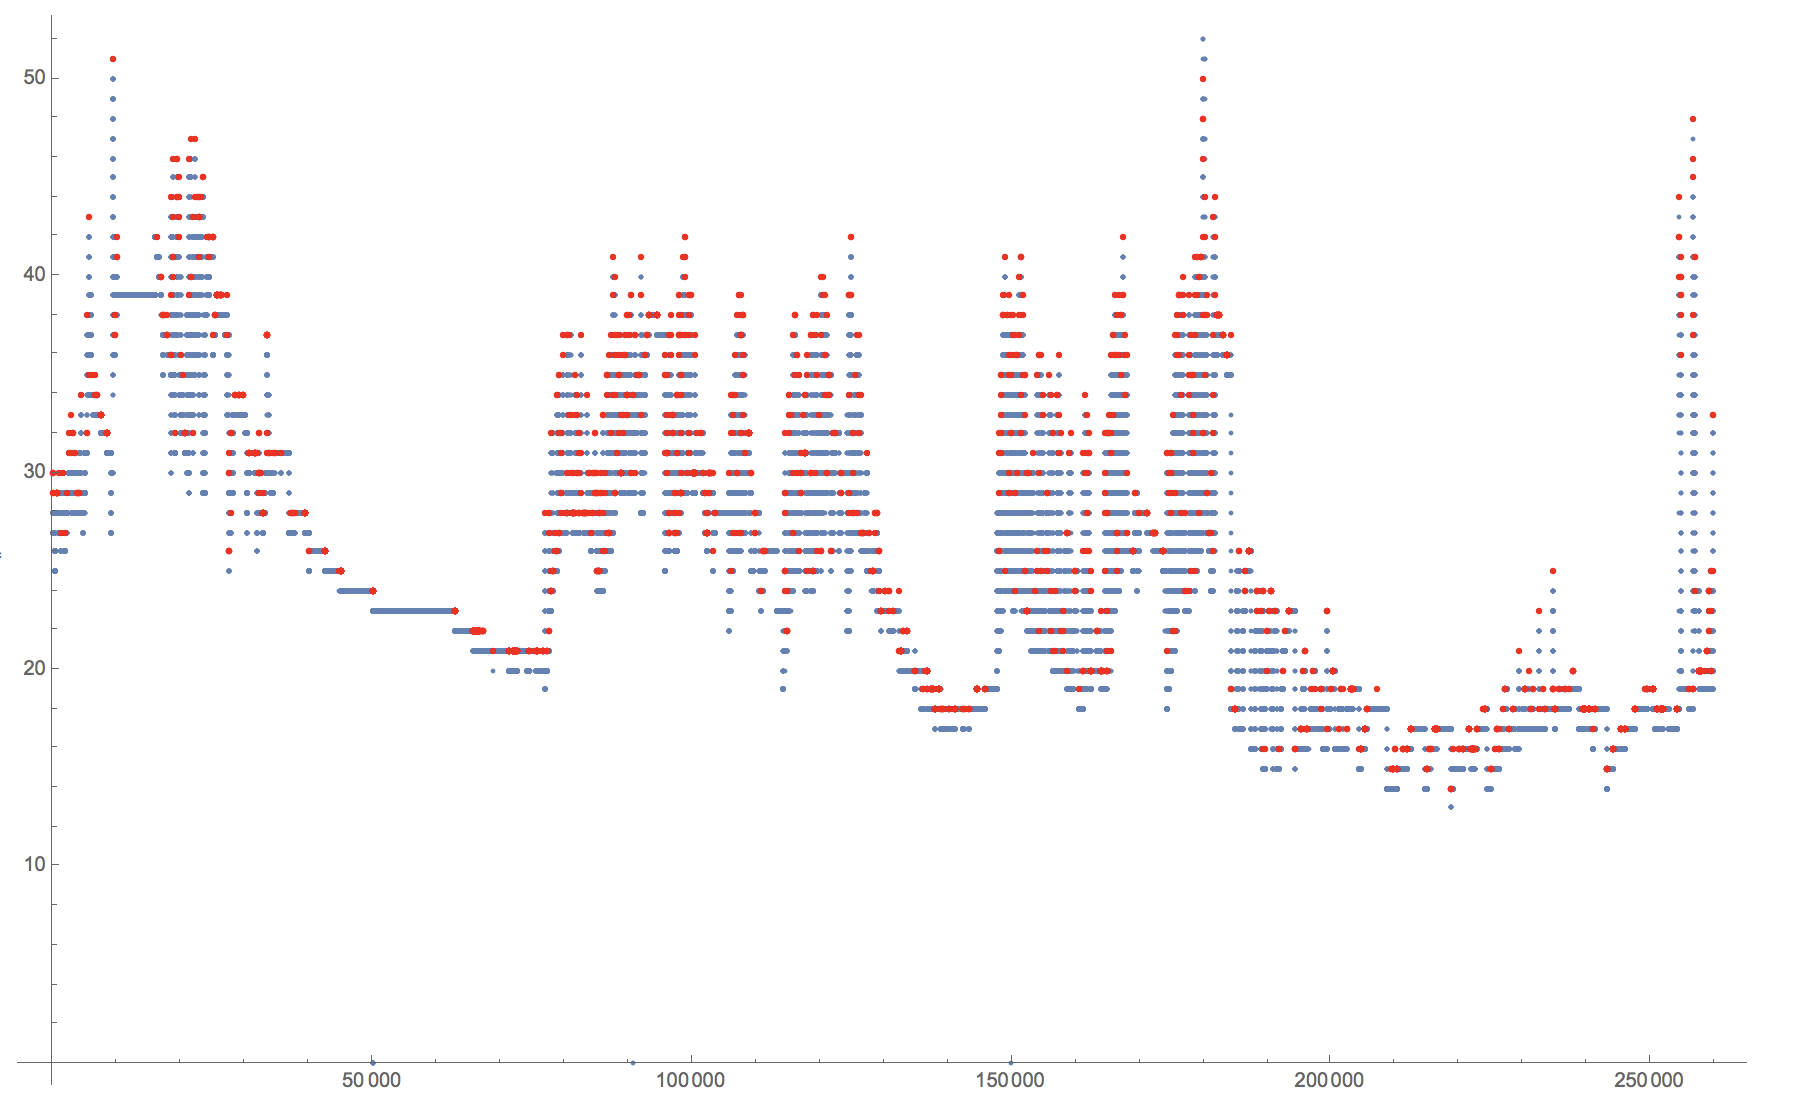
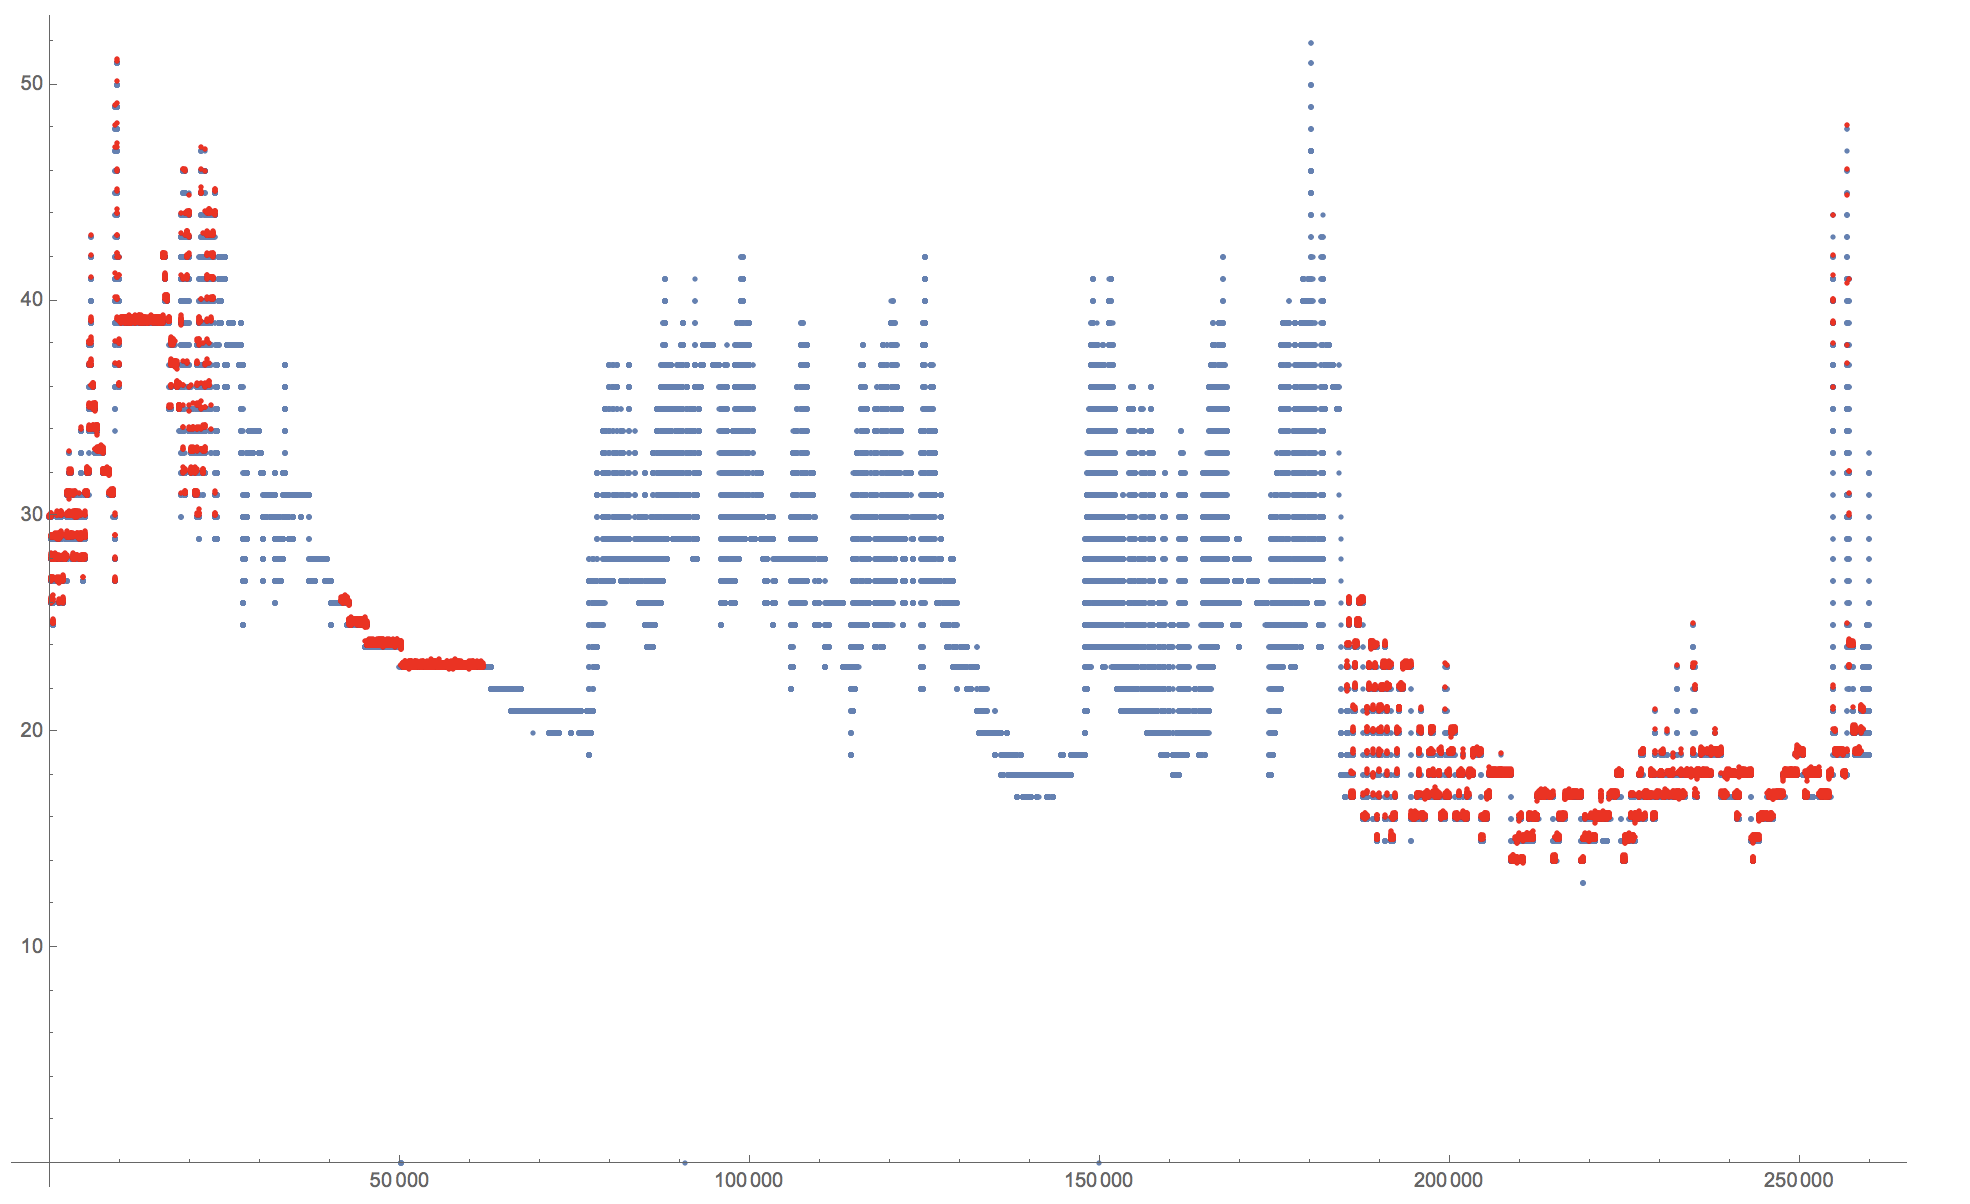
See attached notebook with 1/12 the data. I am sure there is an explanation, but I don't understand the behavior difference between FindPeaks[ , 400], 500, and 600. Perhaps I am simply asking too much of FindPeaks. FindPeaks[ ,500] gets closest to the result I am seeking, in terms of scale.

Attachments:
POSTED BY: Richard Klopp

I have a 1-D list of data with about 3 million elements. The data looks like noise to the naked eye, but it is not noise. If I apply FindPeaks to a 60k-element sub-list Taken from somewhere in the midst of the original data, FindPeaks[sublist,315,0] does a pretty decent job of finding the peaks at the scale I need, finding 22 peaks. If I do FindPeaks[originallist,315,0], I get 25 peaks and none are in the subset. The found peaks are clustered at the front end of the original list. Any clues what is going on? I wish I could share the notebook, but I'm not sure how to do that with 3M points.

POSTED BY: Richard Klopp

If you decimate the data (literally), and maybe use the first third of that, does the issue persist? If so, it would be with 100K elements, which might now be small enough to put into an attached notebook.

POSTED BY: Daniel Lichtblau

Hi Henrik,

I'm very pleased with your support and tips. This is what I'm looking for. Thank You.

Regards,......Jos

POSTED BY: Jos Klaps

Hi Jos,

the way you calculate the peaks you get a result in the form {{index (!), value}, ...}. One possibility is to define your data as a time series and do it like so (compare with documentation on FindPeaks - under "Details and Options"):

ts = Transpose[test];
peaks = Normal@FindPeaks[TimeSeries[ts[[2]], {ts[[1]]}]]; 

Regards -- Henrik

POSTED BY: Henrik Schachner
Reply to this discussion
Community posts can be styled and formatted using the Markdown syntax.
Reply Preview
Attachments
Remove
or Discard

Group Abstract Group Abstract