Dear Richard,
I suppose that the main problem is that there are so many repeated values in your time series. You might want to take that into account somehow. If we define a maximum as a value that is larger than the left and right neighbour then we might run into trouble if there are too many repeated values. So we might first want to identify the repeated values:
testData = Flatten[Import["~/Desktop/temptest.txt", "Data"]];
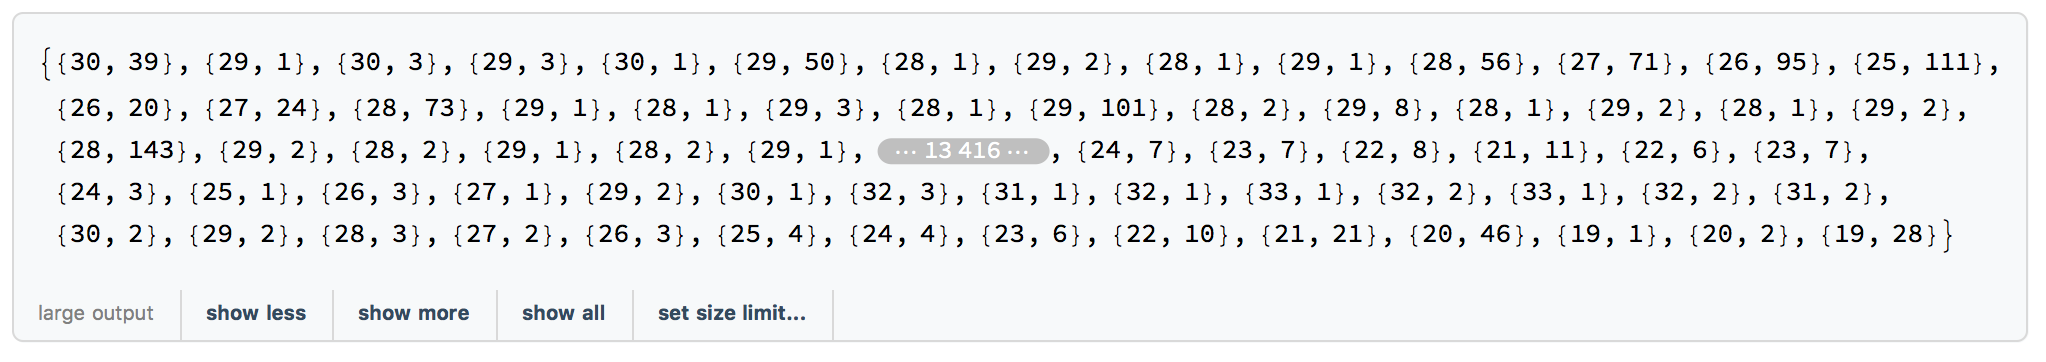
summarydata = {#[[1]], Length[#]} & /@ Split[testData]
The Split function splits the data into groups of identical values. The first bit takes the value and the length of a sublist, so we generate a value and the number of repetitions. The output looks like this:
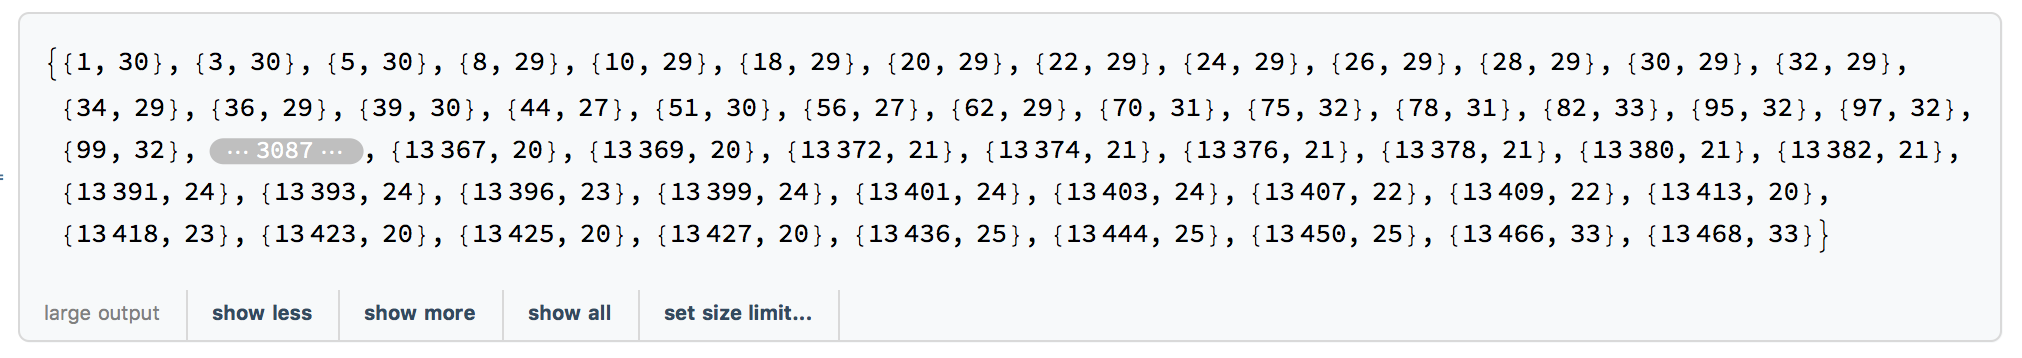
Now we can ignore the repetitions and just look at consecutively different values, i.e. just use values of consecutive plateaus:
summarypeaks = FindPeaks[summarydata[[All, 1]], 1]
Again this does to perform rather well:
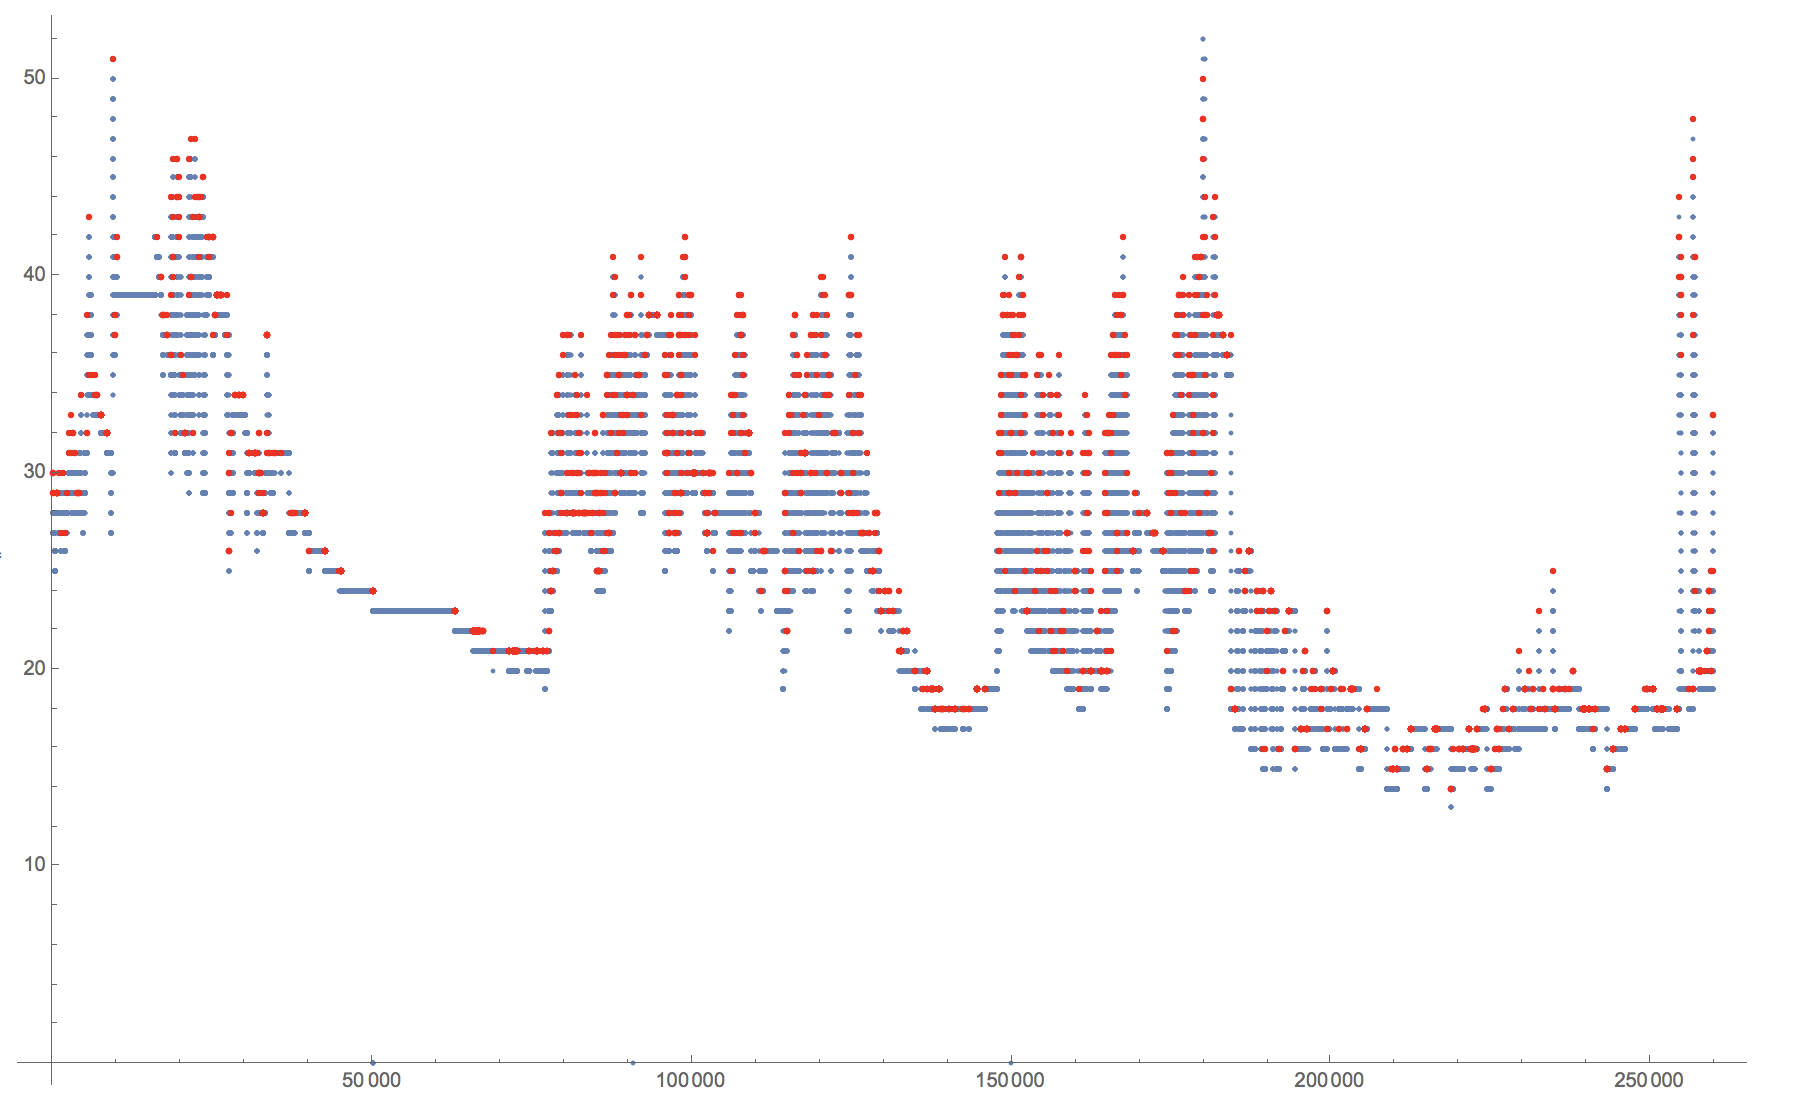
We could now decide to define a "peak" as the first value of a plateau, if the plateau before and after have lower values:
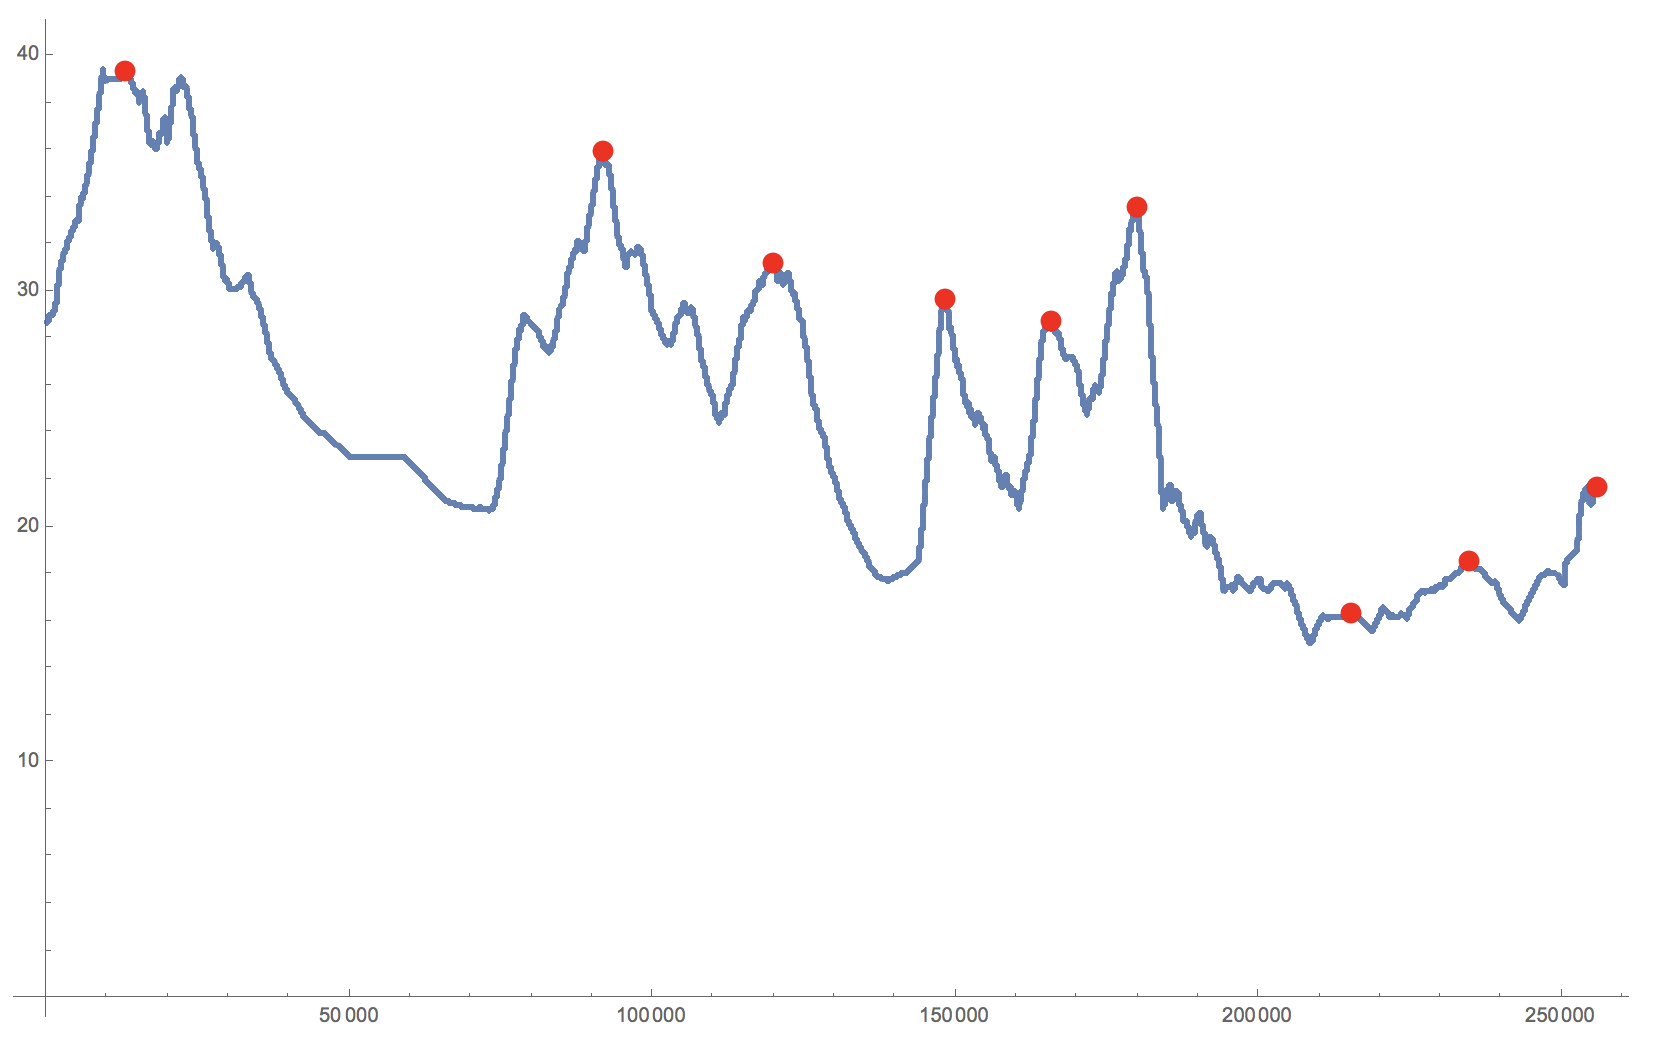
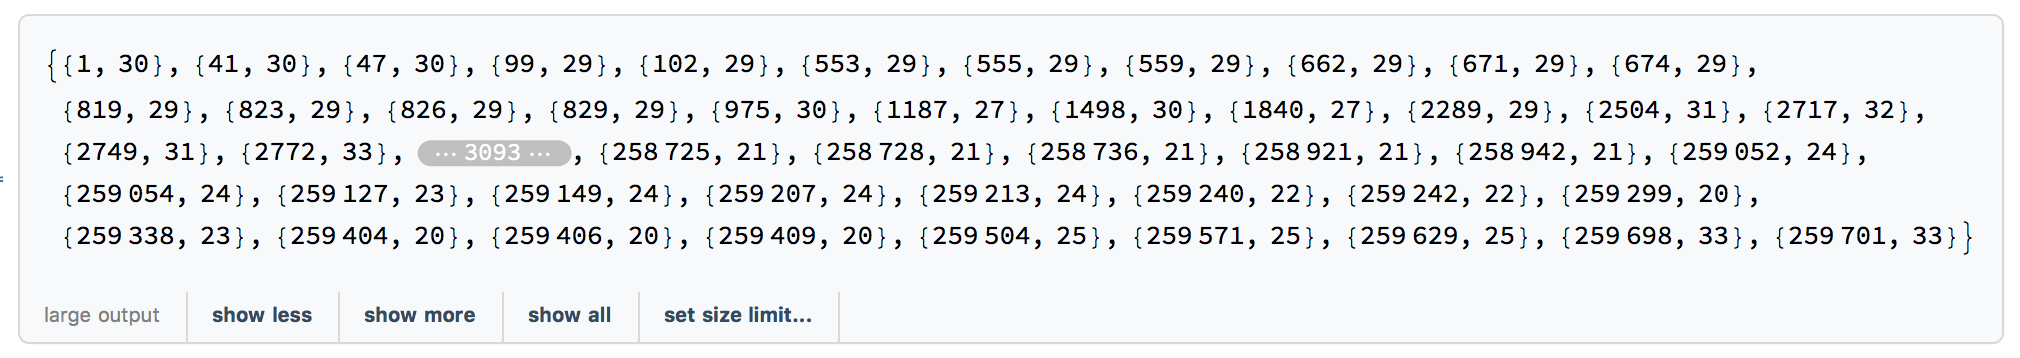
finalpeaks = {Total[summarydata[[1 ;; #[[1]] - 1, 2]]] + 1, #[[2]]} & /@ summarypeaks
Show[ListPlot[testData], ListPlot[finalpeaks, PlotStyle -> Red]]
There is, however, something which I find quite weird about how FindPeak reacts to the following proposition. If the problem is caused by multiple repeated values, adding Noise should fix some that. It would create too many peaks, but should give quite uniformly distributed peaks over the entire dataset. But if I use:
Show[ListPlot[testData], ListPlot[FindPeaks[testData + RandomVariate[NormalDistribution[0, 0.1], 259839]], PlotStyle -> Red]]
I get:
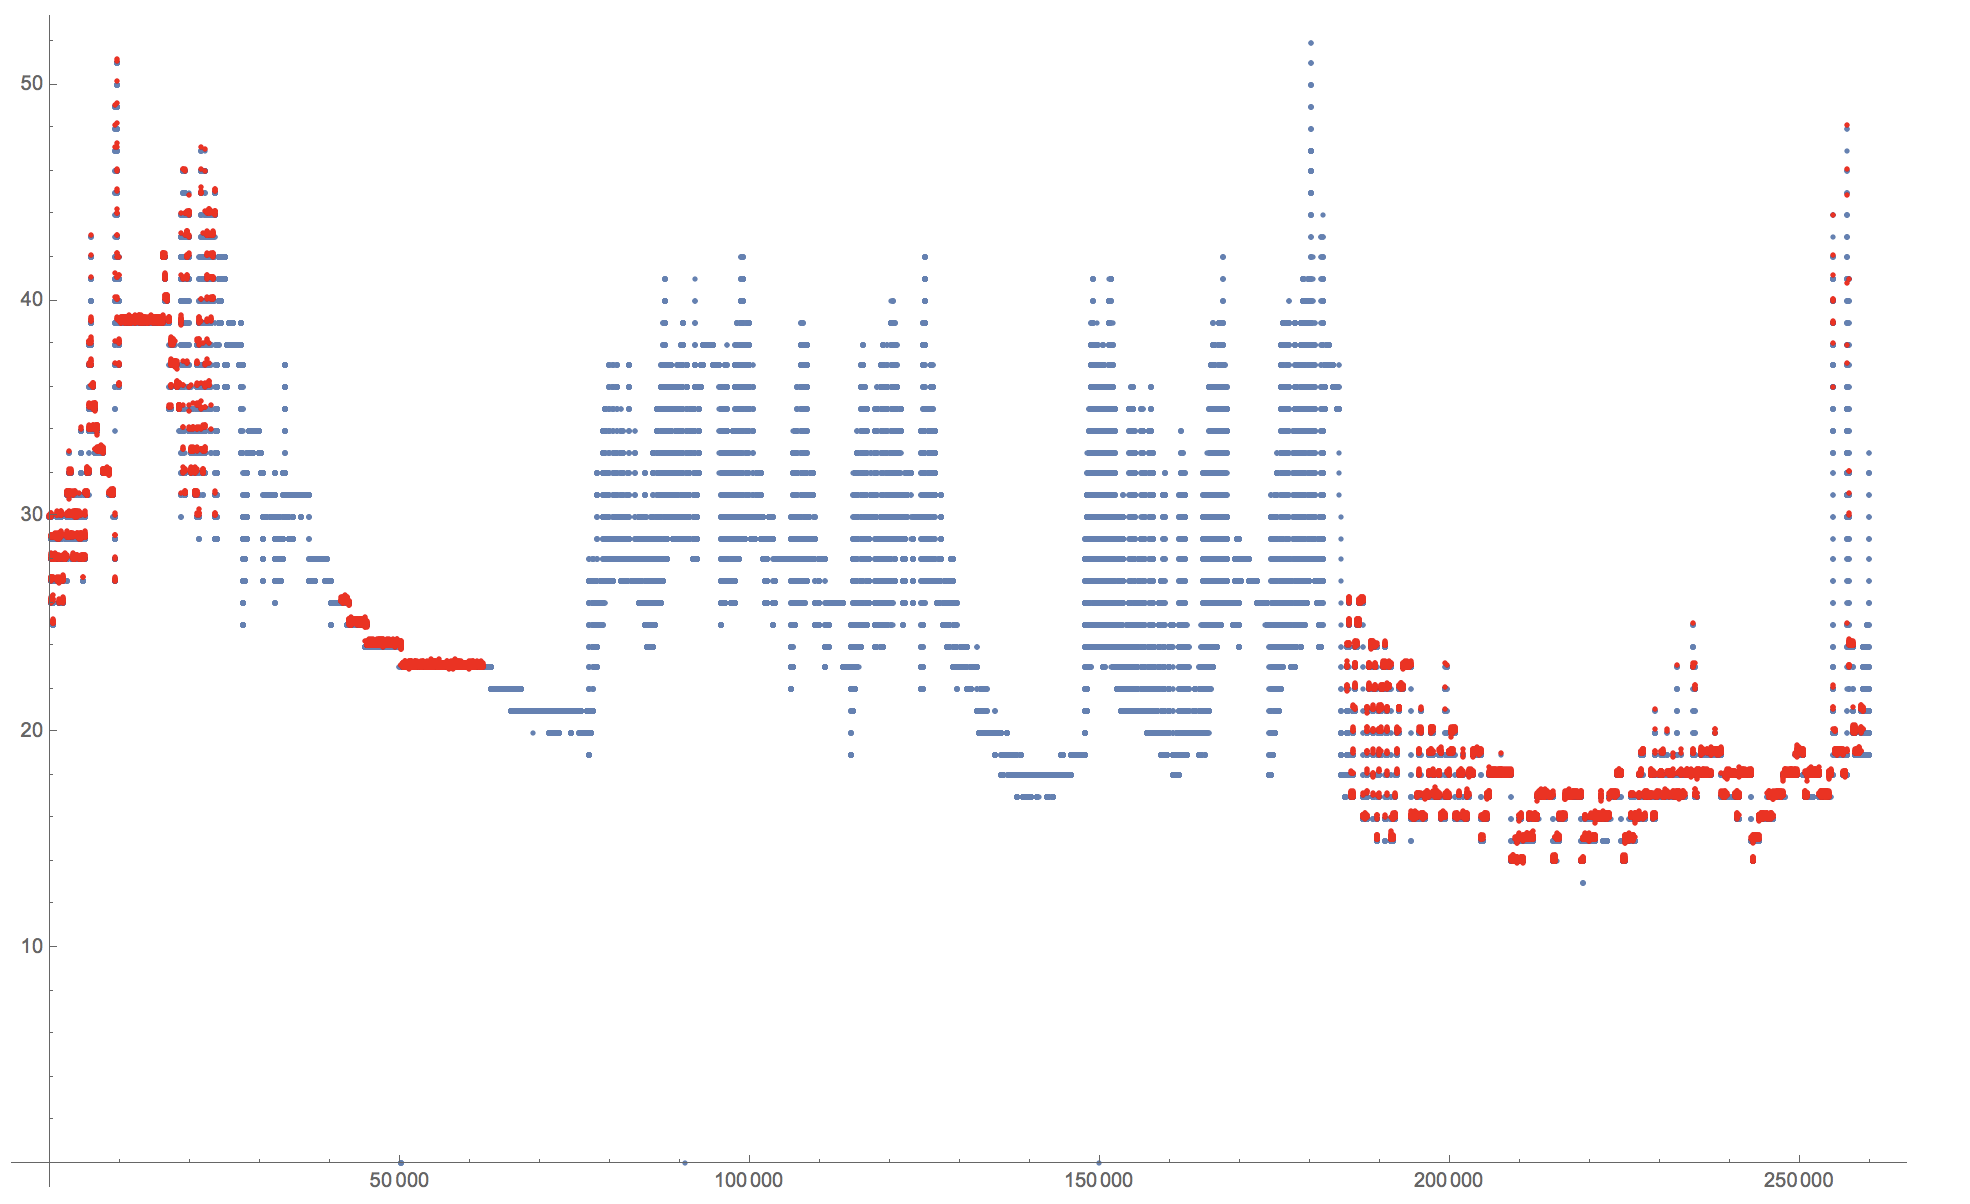
which is slightly unexpected. Perhaps @Daniel Lichtblau can help me out?
Cheers,
Marco
PS: Alternatively, I can of course use MovingAverage:
smoothed = N[MovingAverage[testData, 4000]];
Show[ListPlot[smoothed], ListPlot[peaks, PlotStyle -> Red]]