Message Boards Message Boards

Visualizing the Plot3D axis labels on a RaspberryPi?

When I do any 3D plots, the axis labels show up as unreadable gray squares. For instance:

Plot3D[Sin[x+y^2],{x,-3,3},{y,-2,2}]

Plot3D with illegible axis labels

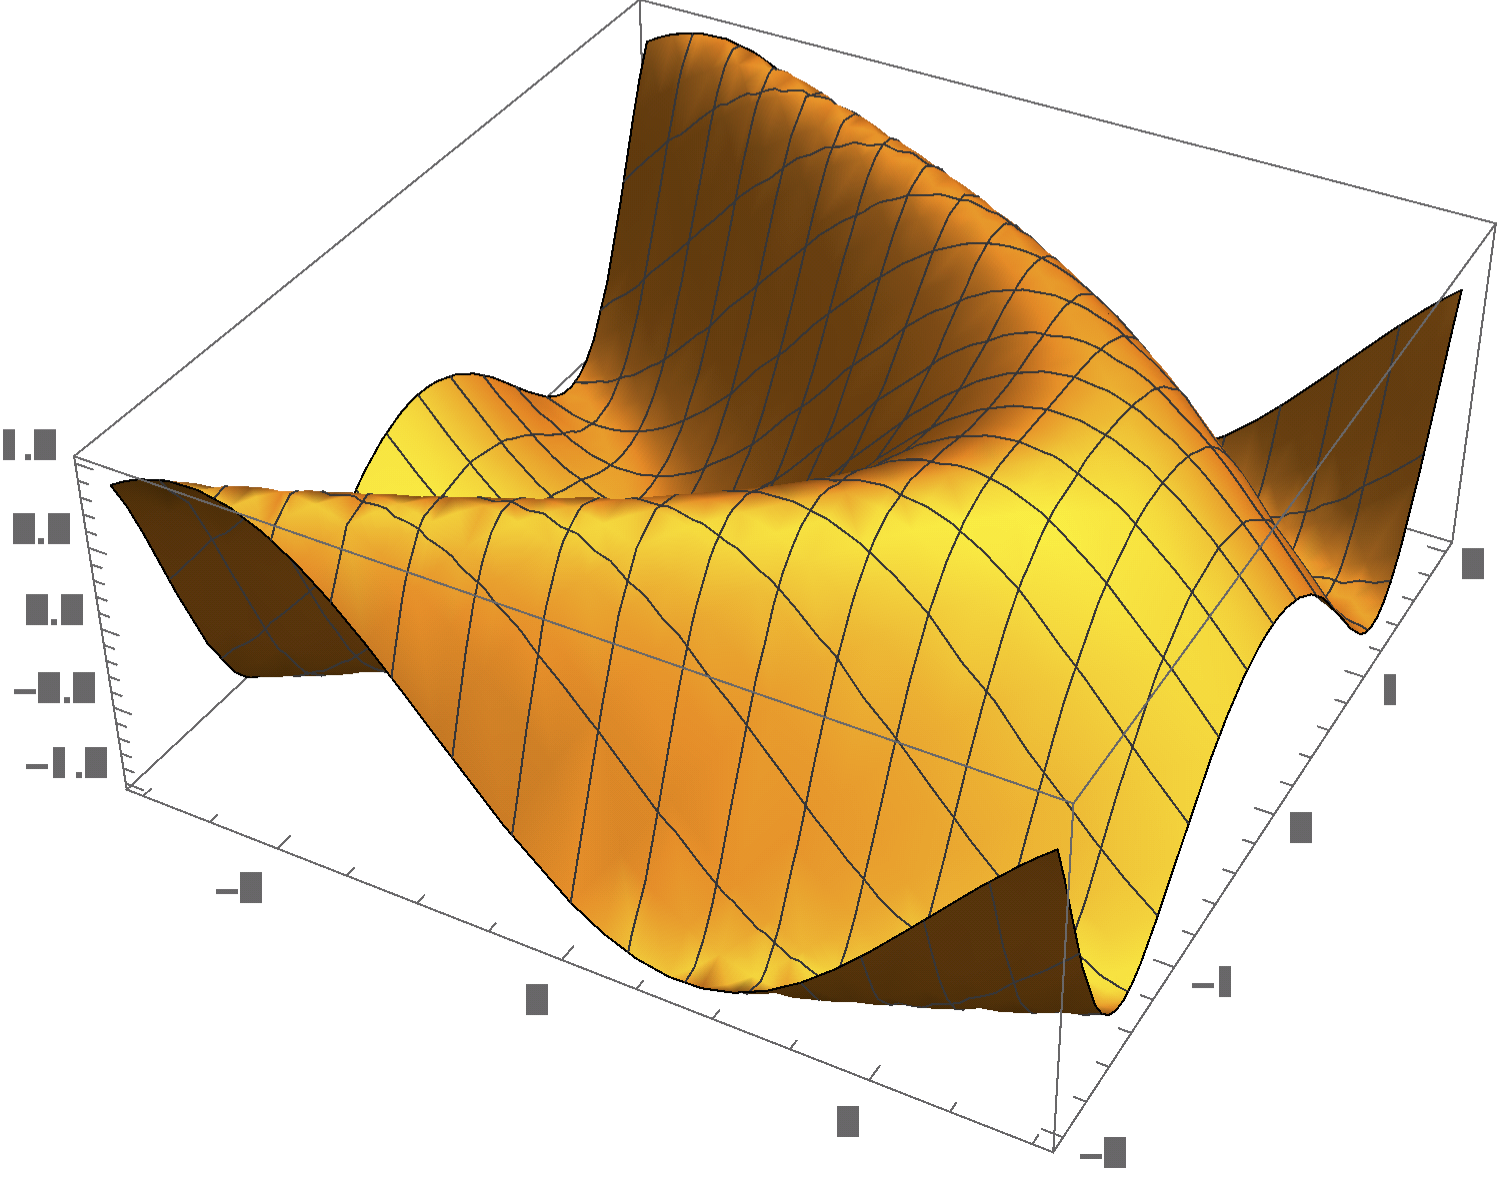
2D plots look fine, so it's only the 3D stuff that's affected. I've tried changing fonts with the FrameStyle command but no change. I'm running Mathematica 10.3.1 on Raspbian 4.1.19. Everything is as up to date as I can make it.

Does anyone know what's going on? I searched the Web for others with this problem but I seem to be the only one.

Thanks for any help.

POSTED BY: Paul McGill
5 Replies

This is due to the Raspberry Pi using 16-bit color depth by default, try using 24-bit color.

POSTED BY: Ilian Gachevski

Ilian, you're a genius! Changing to 24-bit color depth fixed the problem and I now have axis labels in 3D plots. I can't believe that more people haven't run across this since I was running a completely stock configuration. I hope this thread will save someone else the same frustration.

POSTED BY: Paul McGill

Thanks for bringing the issue up. I have seen it myself but since the 3D graphics performance still needs some tweaking, I haven't bothered debugging. Glad to hear that the 16-24 bit color fix is an easy one to implement.

POSTED BY: BoB LeSuer

I cannot imagine how this would happen.

Most likely, this is some very strange configuration in your preferences. I recommend clearing that out. Please see this article on doing that:

http://support.wolfram.com/kb/12464

POSTED BY: Sean Clarke

Thanks for the reply Sean, but this didn't help. Knowing how to clear Mma preferences may be useful in the future though, so thanks for that.

POSTED BY: Paul McGill
Reply to this discussion
Community posts can be styled and formatted using the Markdown syntax.
Reply Preview
Attachments
Remove
or Discard

Group Abstract Group Abstract