Group Abstract Group Abstract

Message Boards Message Boards

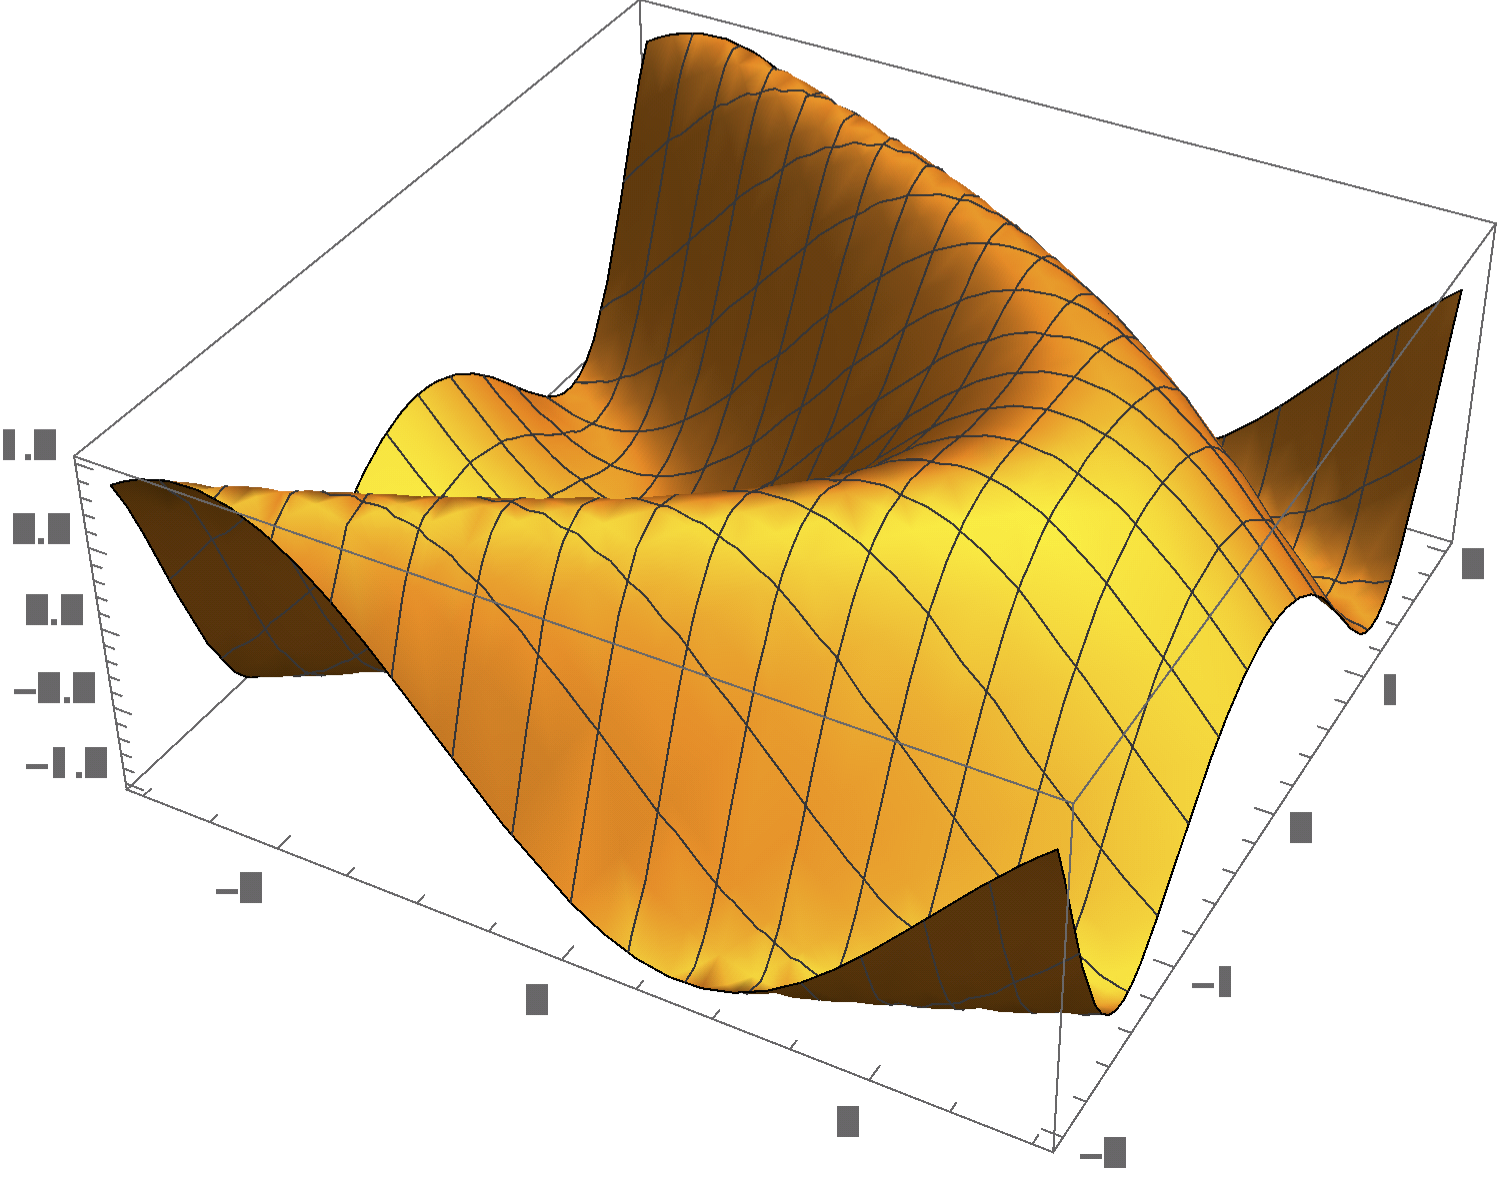
Visualizing the Plot3D axis labels on a RaspberryPi?

POSTED BY: Paul McGill
5 Replies

Thanks for bringing the issue up. I have seen it myself but since the 3D graphics performance still needs some tweaking, I haven't bothered debugging. Glad to hear that the 16-24 bit color fix is an easy one to implement.

POSTED BY: BoB LeSuer

Ilian, you're a genius! Changing to 24-bit color depth fixed the problem and I now have axis labels in 3D plots. I can't believe that more people haven't run across this since I was running a completely stock configuration. I hope this thread will save someone else the same frustration.

POSTED BY: Paul McGill

Thanks for the reply Sean, but this didn't help. Knowing how to clear Mma preferences may be useful in the future though, so thanks for that.

POSTED BY: Paul McGill

This is due to the Raspberry Pi using 16-bit color depth by default, try using 24-bit color.

POSTED BY: Ilian Gachevski

I cannot imagine how this would happen.

Most likely, this is some very strange configuration in your preferences. I recommend clearing that out. Please see this article on doing that:

http://support.wolfram.com/kb/12464

POSTED BY: Sean Clarke
Reply to this discussion
Community posts can be styled and formatted using the Markdown syntax.
Reply Preview
Attachments
Remove
or Discard