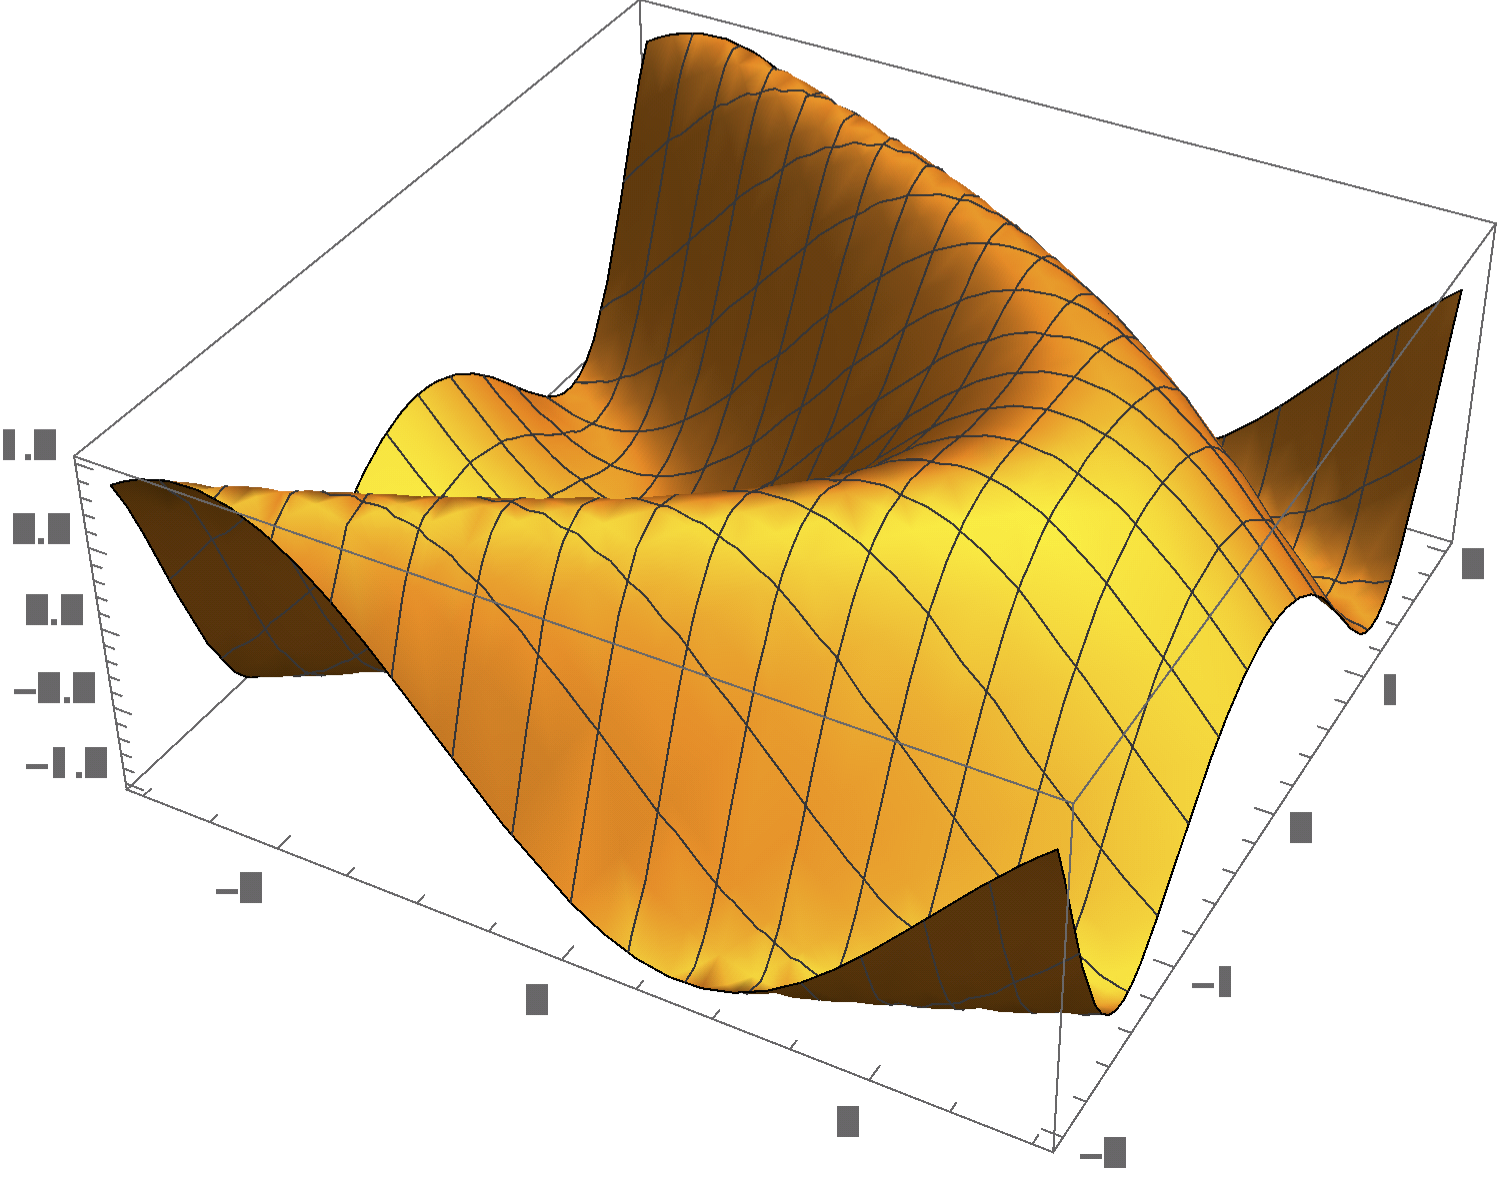
When I do any 3D plots, the axis labels show up as unreadable gray squares. For instance:
Plot3D[Sin[x+y^2],{x,-3,3},{y,-2,2}]

2D plots look fine, so it's only the 3D stuff that's affected. I've tried changing fonts with the FrameStyle command but no change. I'm running Mathematica 10.3.1 on Raspbian 4.1.19. Everything is as up to date as I can make it.
Does anyone know what's going on? I searched the Web for others with this problem but I seem to be the only one.
Thanks for any help.