I sometimes get asked what is the best way to style edges and vertices with different numerical values, like weights or centrality measures, for example. In this post i will go over small graphs, because large graphs are a very different story and require a different, sometimes opposite approach.
A network is a messy creature, so the rule of thumb is making styling as simple as possible to soothe the mess, but of course not simpler ;-)
To proceed further we'll need to define a small weighted graph:
numV = 15; numE = 30;
ew = RandomReal[1, numE];
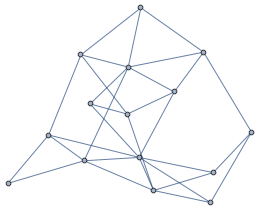
g = RandomGraph[{numV, numE}, EdgeWeight -> ew]

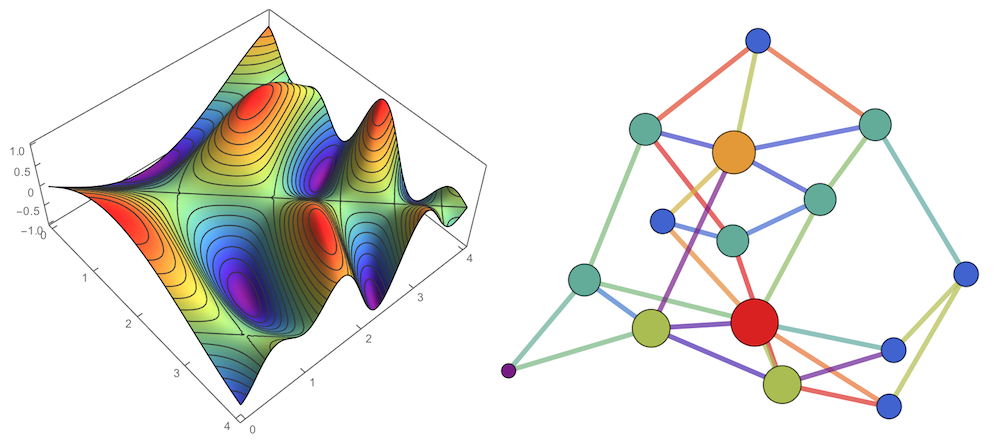
As you can see, in this basic format, there is no visual information about edge weights or vertex properties. First thing to understand is that a graph or network is visually a very complex randomly looking thing. Because a graph consists of distinct elements, it is visually rather discrete, especially comparing to a surface, which is mostly continuous. This leads to an important realization. In continuos smooth objects color variations are compared locally between neighboring regions. This is why the surface below looks so good with "Rainbow" color scheme, - locally there is not mach change in color variations, even so globally there is, - the vision is not overloaded with jumpy color variations but flows smoothly in small increments. While for the graph "Rainbow" color scheme looks very busy, because there is no continuous change between cold and hot elements and it is hard to estimate numerical values from colors.

Plot3D[Sin[x - y] Cos[x y], {x, 0, 4}, {y, 0, 4},
 ColorFunction -> "Rainbow", PlotPoints -> 70, PlotTheme -> "Web"]

vd = VertexDegree[g];
SetProperty[g, {
  VertexSize -> Thread[VertexList[g] -> .8 N[.1 + Rescale[vd]]^.5],
  VertexStyle -> Thread[VertexList[g] -> (ColorData["Rainbow"] /@ Rescale[vd])],
  EdgeStyle -> Thread[EdgeList[g] ->
  (Directive[Thickness[.01], ColorData["Rainbow"][#]] & /@ Rescale[ew])]
}]
This leads to a few rules that I tend to apply when styling small graphs.
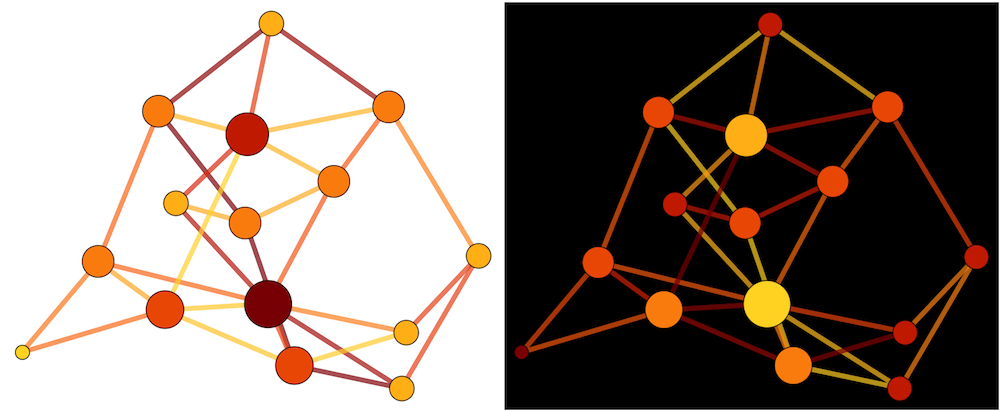
Contrast with background. For surfaces (or continuous bodies) hot color usually indicates higher values. Inverting a color scheme maybe confusing. On the contrary, graphs are visually contrasted with backgrounds. This is why both direct and inverted color schemes will work for graphs. For example if the background is white, darker colors will indicate higher values. If the background is black, lighter colors will indicate higher values. So this leads to the next rule...
...colors do not really matter, intensities do. Use uniform quasi-mono color schemes that mostly change intensity, and do not jump around with too much color variations. So for small graphs I would prefer "SolarColors" or "CherryTones" to "Rainbow" or "TemperatureMap".

Do not use opacity for edges or vertices. It makes sense for large graphs, because you are blending massive things there, deemphasizing a mess of individual things. In contrast, for small graphs you still want to show all the very few details the graph has. Transparent edges vanishing visually are depraving people from perception of full information.
Use enlarged but fixed edge thickness. Varying edge width to reflect upon weights is not effective, because too thin or thick edges are unappealing and thus there is just a narrow range of visually-nice variations that is too constrained to transfer associated numerical information well.
Use the same color scheme for vertices and edges, otherwise it will be destructive according to our "rule fo thumb".
Varying vertices in size is nice. They have much larger range of elegant visible size variations than edges. Because edges are 1D as lines, and vertices are 2D as disks.
Simultaneous variation of vertex size and color positively amplifies the effect. There is no conflict here, just harmony.
Adjust too high or too narrow ranges of vertex-size variations with scaling functions for VertexSize, for instance $.8( .1+size^.5 )$. This is to avoid the situations like shown below, when you have a lot of vanishing point-sized vertices and a few over-sized ones covering other graph details.

In summary of all the rules, both of the images at the top of this post (or below) work:
    vd=VertexDegree[g];
    SetProperty[g,{
    VertexSize->Thread[VertexList[g]->.8N[.1+Rescale[vd]]^.5],
    VertexStyle->Thread[VertexList[g]->(ColorData[{"SolarColors","Reverse"}]/@Rescale[vd])],
    EdgeStyle->Thread[EdgeList[g]->(Directive[Thickness[.01],ColorData[{"SolarColors","Reverse"}][#]]&/@Rescale[ew])]
    }]

    vd=VertexDegree[g];
    SetProperty[g,{
    Background->Black,
    VertexSize->Thread[VertexList[g]->.8N[.1+Rescale[vd]]^.5],
    VertexStyle->Thread[VertexList[g]->(ColorData["SolarColors"]/@Rescale[vd])],
    EdgeStyle->Thread[EdgeList[g]->(Directive[Thickness[.01],ColorData["SolarColors"][#]]&/@Rescale[ew])]
    }]

 Attachments: