CLICK to ZOOM: click on the top image to zoom and see the details.
Vitaliy pointed out this interesting question: if you started navigating the sea perpendicularly to your favorite seashore and kept moving straight, which other place would you reach? One cannot answer this question just by tracing a straight line on a map, because that does not take into account the curvature of the Earth's surface. We must trace geodesics and see where they lead us. Let us do that with the Wolfram Language.
We basically need two ingredients: a way to construct geodesics and a way to detect whether we already reached land again. To construct geodesics, we shall use GeoPath. To check whether we reached land we shall simply check if our boat has crashed, that is, whether GeoElevationData reports a positive elevation for our current position. Let us start with the latter:
Take an array of elevations covering the whole world. We choose zoom 3 to have good resolution:
In[1]:= Dimensions[ elevation = Reverse@ QuantityMagnitude[GeoElevationData["World", GeoZoomLevel -> 3]] ]
Out[1]= {1024, 2048}
Now construct an interpolating function from that data:
In[2]:= elevationF = ListInterpolation[elevation, {{-90, 90}, {-180, 180}}];
The function that will tell us whether we are still at sea when our coordinates are {lat, lon} is the following. We use Mod to handle any longitude angle determination:
In[3]:= seaQ[{lat_, lon_}] := Less[elevationF[lat, Mod[lon, 360, -180]], 0];
For example, the coordinate origin is at sea:
In[4]:= seaQ[{0, 0}]
Out[4]= True
Now let us construct the geodesic that moves perpendicularly from a given segment of seashore, say the segment from the point p to the point q, starting from the midpoint of the segment. We have to tell the function whether we want to start navigating towards the right or the left. We will use a sign (+1, -1, respectively) to indicate that:
In[5]:= geopath[{p_, q_}, sign_] := Module[{init, dist, dir, points},
    (* Initial point of the geodesic *)
    init = Mean[{p, q}];
    (* Maximum distance to navigate *)
    dist = Quantity[35000, "Kilometers"];
    (* Initial direction of navigation *)
    dir = GeoDirection[p, q] + sign Quantity[90, "AngularDegrees"];
    (* Points of the geodesic *)
    points = Reverse[Flatten[GeoGraphics`GeoEvaluate[GeoPath[{init, dist, dir}], Automatic, 50000] /. Line -> Identity, 1], 2];
    (* Points of the geodesic at sea, until reaching the first inland point *)
    points = Prepend[TakeWhile[Rest[points], seaQ], init];
    (* The GeoPath geo primitive to be drawn with GeoGraphics *)
    GeoPath[points, "TravelPath", VertexColors -> {Green, Red}]
  ]
The use of GeoGraphics`GeoEvaluate requires explanation. This function converts a GeoPrimitive into standard Graphics primitives, and it is one of the internal steps of GeoGraphics. Its second argument specifies the geo model, that is the planet or datum (basically ellipsoidal model) of the Earth we are using; Automatic means here the default "ITRF00" datum of the Earth. Its third argument specifies the resolution in meters, so that consecutive points of the result will be separated no more than 50km. Finally, Reverse and Flatten convert back to the notation we need: a list of {lat, lon} points.
We are now ready to draw the geodesics. Take the polygons of the world. We have a complete form and a simplified form:
In[6]:= pol = EntityValue[Entity["GeographicRegion", "World"], "Polygon"];
In[7]:= spol = EntityValue[GeoVariant[Entity["GeographicRegion", "World"], "SimplifiedArea"], "Polygon"];
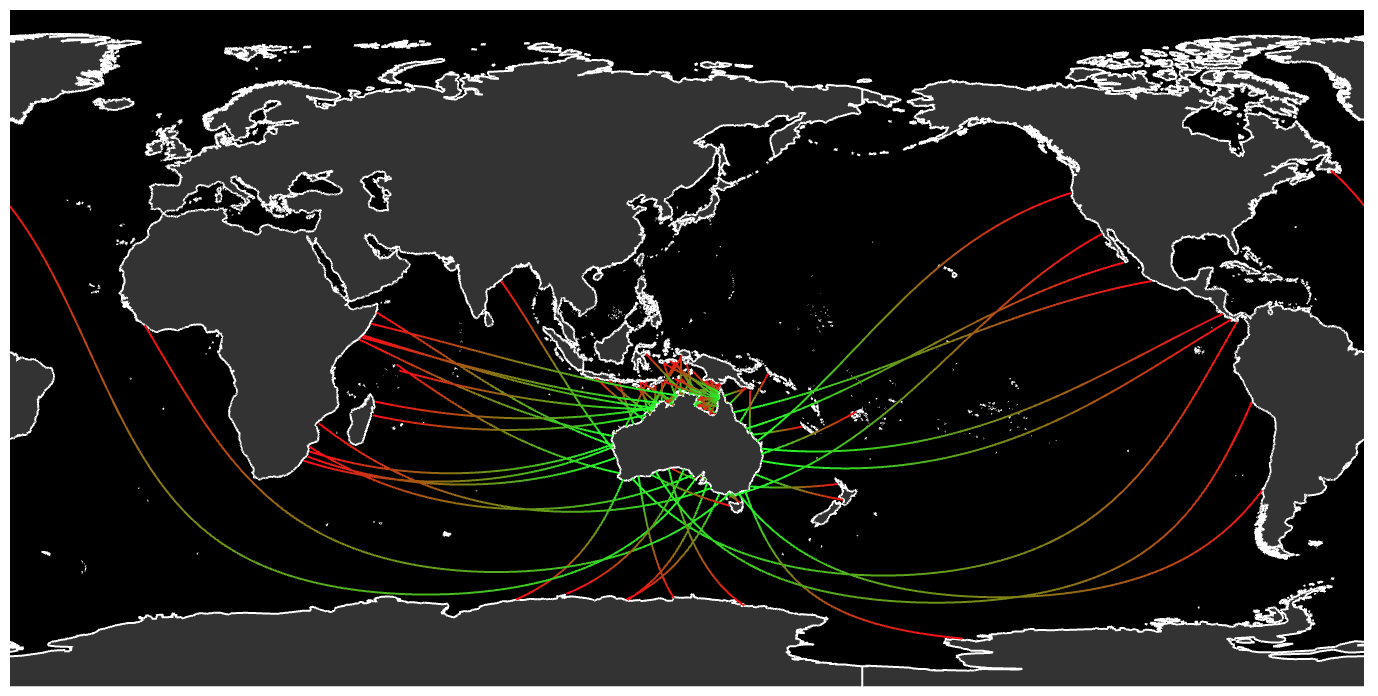
First example: draw geodesics from the segments of the simplified polygon of Australia. There are 192 points in our current version of this polygon:
In[8]:= Length[ australia = EntityValue[GeoVariant[Entity["Country", "Australia"], "SimplifiedArea"], "Polygon"][[1, 1, 1]] ]
Out[8]= 192
Construct the geodesics. We need to start moving towards the left, so use sign -1:
In[9]:= paths = geopath[#, -1] & /@ Subsequences[australia, {2}];
Draw them with GeoGraphics, using Vitaliy's favorite black&white mapstyle. The beginnings of the geodesics are represented in green, and their ends are in red color:
In[10]:= GeoGraphics[{FaceForm[White], EdgeForm[White], pol, paths}, GeoBackground -> Black, GeoCenter -> Mean[australia]]
Let us now do the same thing, but with the complete polygon of Australia. We now have many more points:
In[11]:= Length[ australia = EntityValue[Entity["Country", "Australia"], "Polygon"][[1, 1, 1]] ]
Out[11]= 5140

In[12]:= GeoGraphics[{FaceForm[White], EdgeForm[White], pol, paths}, GeoBackground -> Black, GeoCenter -> Mean[australia]]
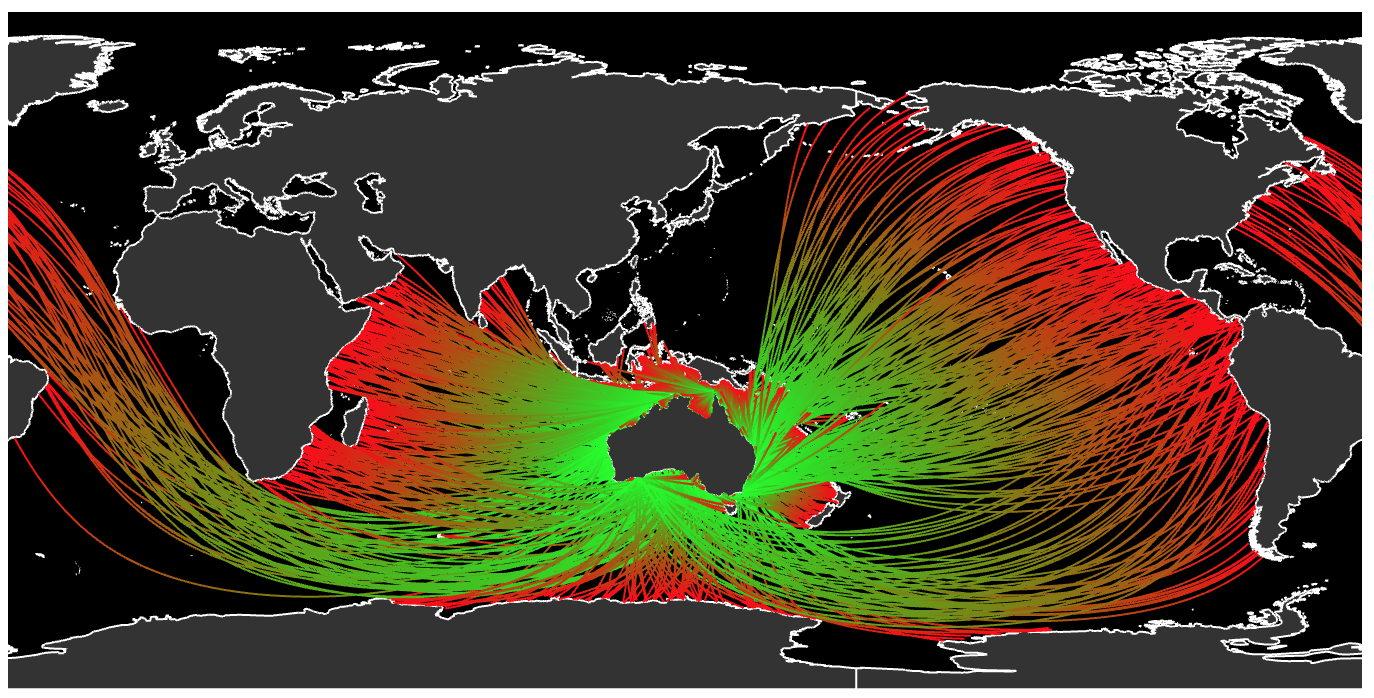
It is quite interesting to see how many places we can reach from Australia. In particular we can reach the US East coast, after crossing the Atlantic!
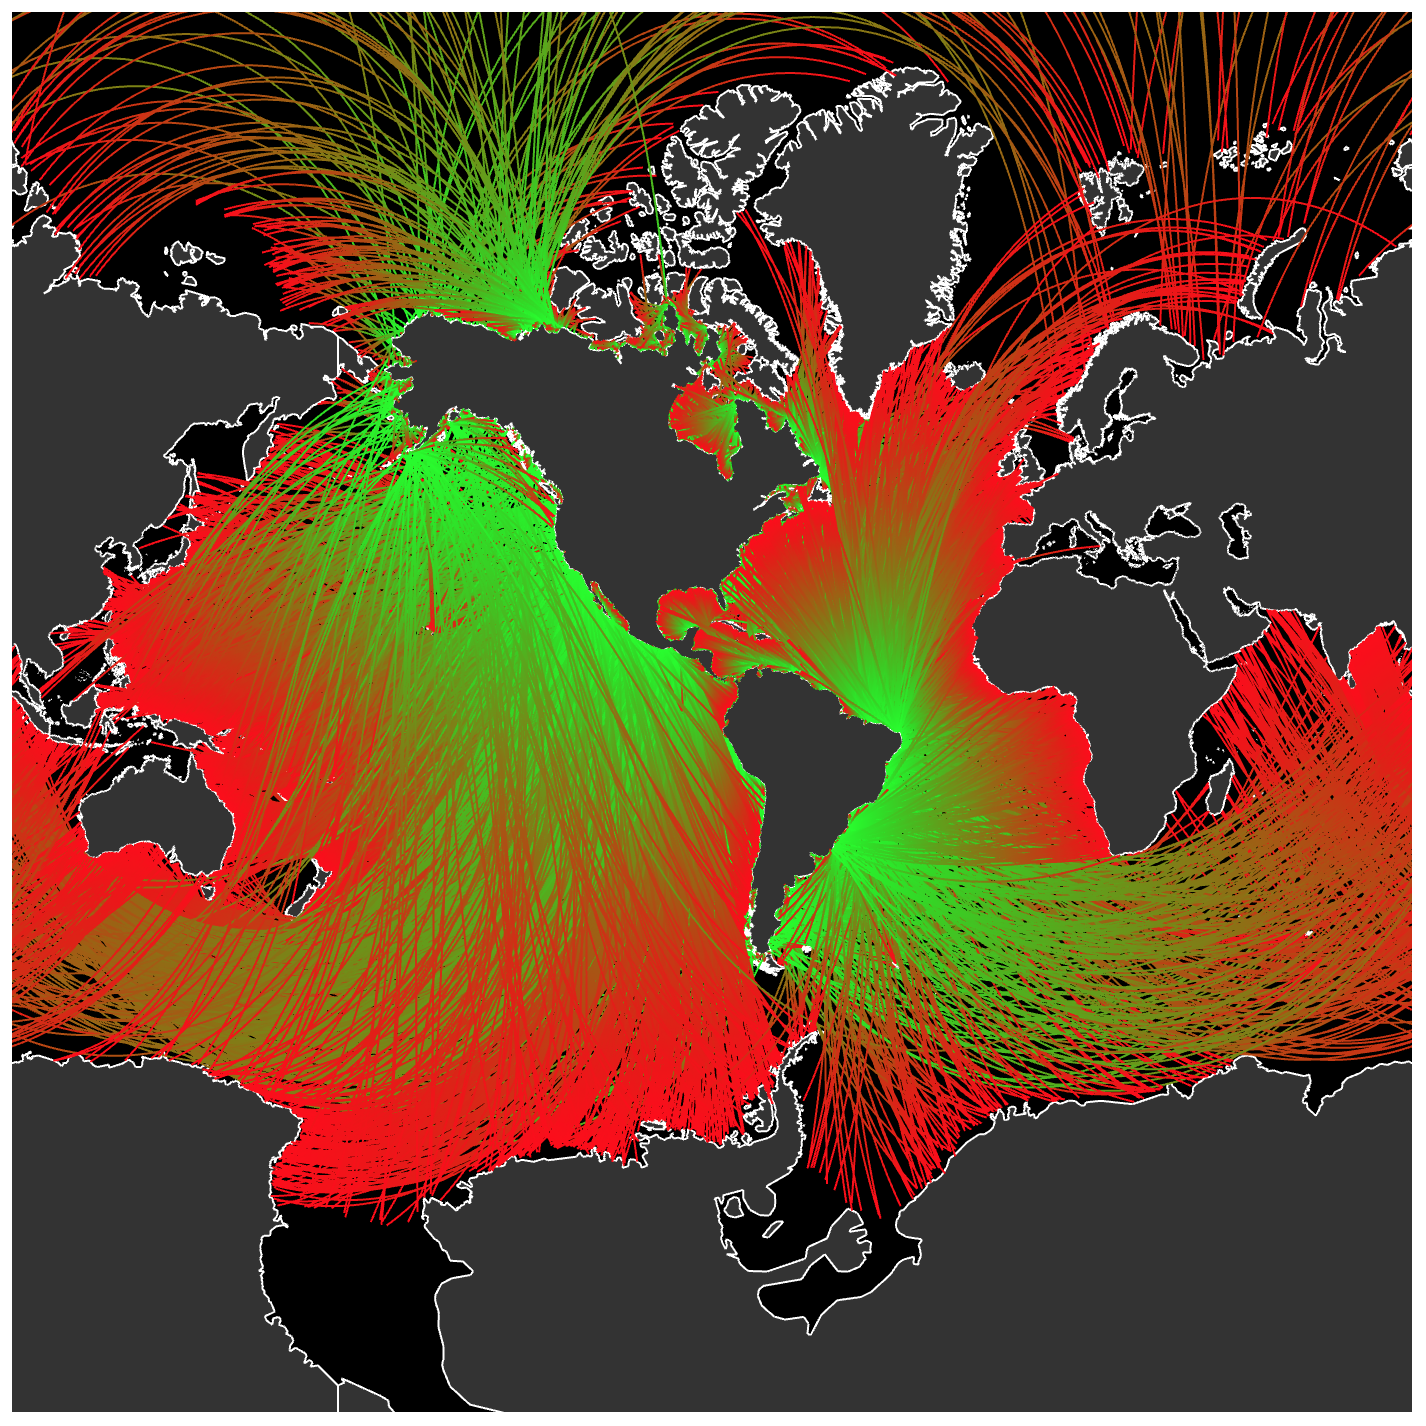
And finally, let us do the same thing for the polygon of the Americas. We extract it from the polygons of the world:
In[13]:= Length[america = spol[[1, 2, 1, 1, 1, 1, 1]]]
Out[13]= 1333

In[14]:= paths = geopath[#, -1] & /@ Subsequences[america, {2}]];

In[15]:= GeoGraphics[{FaceForm[White], EdgeForm[White], pol, paths}, GeoBackground -> Black, GeoCenter -> Mean[america]]
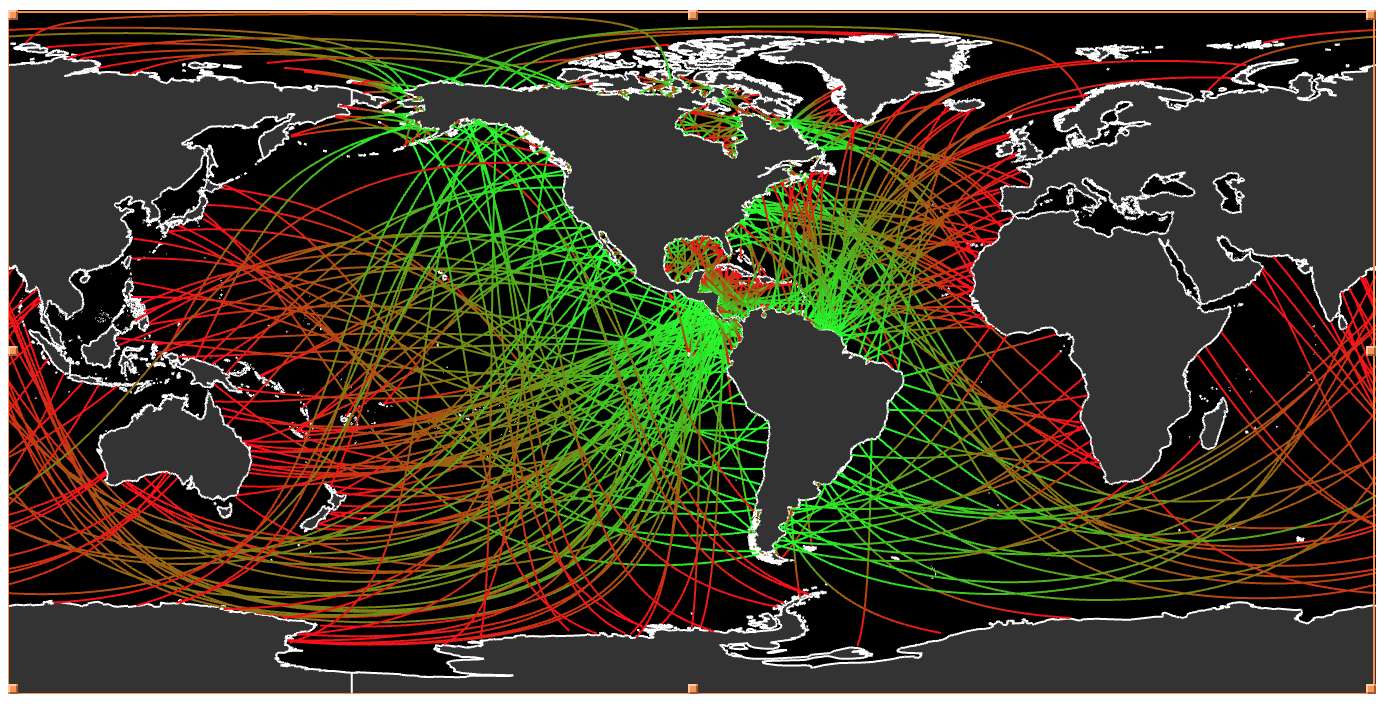
This time, let us use the Mercator projection. There are many segments, so be patient...
In[16]:= Length[america = pol[[1, 2, 1, 1, 1]]]
Out[16]= 22751

In[17]:= paths = geopath[#, -1] & /@ Subsequences[america, {2}]];

In[18]:= GeoGraphics[{FaceForm[White], EdgeForm[White], pol, Thin, paths}, GeoBackground -> Black, GeoCenter -> Mean[america], GeoProjection -> "Mercator"]
Note that GeoElevationData is a bit imprecise in the area of the East Siberian sea, north of Russia, where the seafloor is not very deep, and the geodesics get interrupted there. There are also some discrepancies around Antarctica, due to the ice masses.
Jose.


