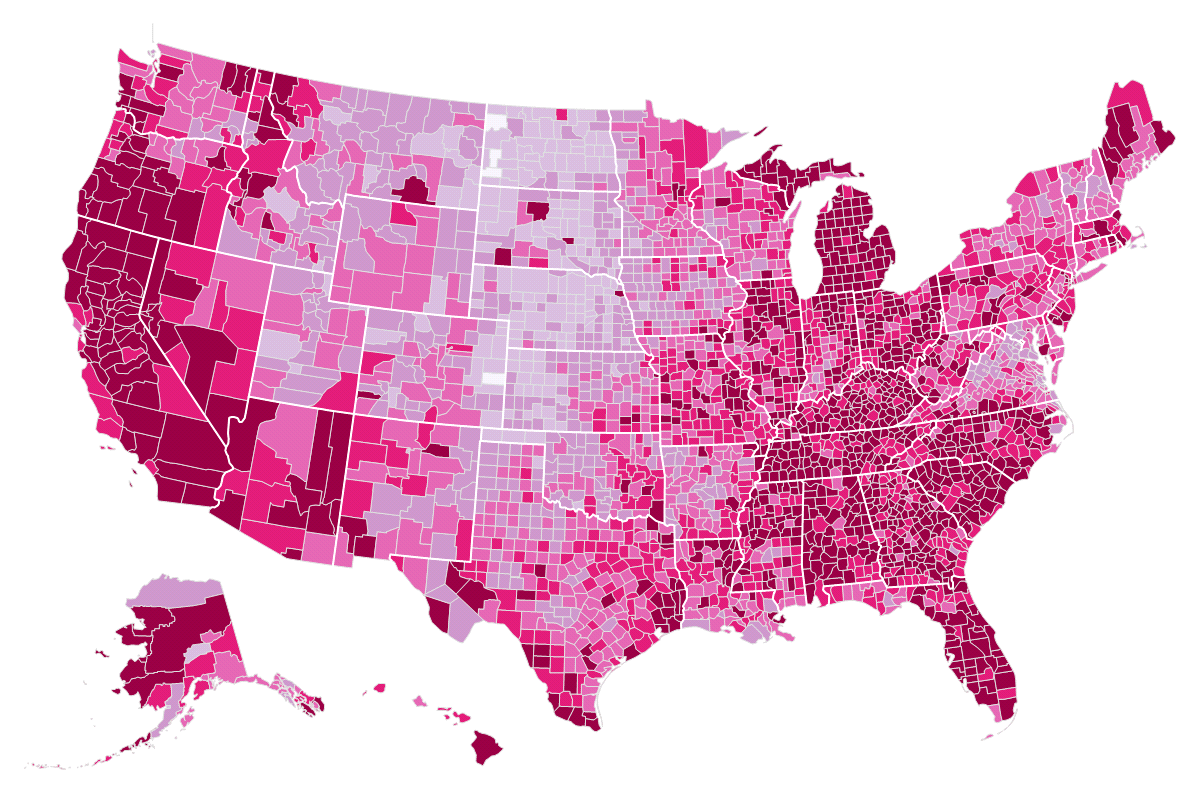
You perhaps mean
this map? I think one of the most amazing Mathematica blogs I ever seen -
Lunchtime Playground: Fun with Mathematica - has exactly what you need. The conclusion is that you can import .SVG file as XML data. He made a
nice post about it and attached his notebook and additional files. You will need to get the files from his site ( or from
here), but because of the author's kind sharing terms (and because the code's exceptional quality), I would like to repost the code here - you can find it below the image. Also take a look att the following recources:
Mathematica North America map
Analyzing U.S. 2008 Elections with Mathematica
What would a minimal example for a choropleth map in Mathematica look like?
(* source http://flowingdata.com/2009/11/12/how-to-make-a-us-county-thematic-map-using-free-tools *)
SetDirectory[NotebookDirectory[]];
xml = Import["USA_Counties_with_FIPS_and_names.svg", "XML"];
(* extract path *)
dataxml = Cases[xml, XMLElement["path", x_, _] :> x, Infinity];
(* extract polygon *)
extractMap[path_] :=
Module[{d, di, id}, d = "d" /. path; id = "id" /. path;
di = Map[Partition[#, 2] &,
ToExpression[
StringSplit[
StringReplace[
StringSplit[d, "M"], {"L" -> ",", "e" -> "E", "z" -> ""}],
","]]]; di[[All, All, 2]] = -di[[All, All, 2]]; {id, di}];
polys = extractMap[#] & /@ dataxml;
statelines = polys[[-2, 2]];
counties = polys[[1 ;; -3]];
(* import data *)
data = Import["unemployment09.csv", "CSV", "Numeric" -> False];
graphdata =
ToString[#[[2]] <> #[[3]]] -> ToExpression[#[[9]]] & /@ data;
rate = # /. graphdata & /@ counties[[All, 1]];
(* processing missing data *)
missing = First[Position[rate, _String]];
rate[[missing]] = -1;
(* assign color by rate *)
colorsystem =
RGBColor @@@ ({{241, 238, 246}, {212, 185, 218}, {201, 148,
199}, {223, 101, 176}, {221, 28, 119}, {151, 0, 67}}/255);
hotcolor[r_] :=
Which[r > 10, colorsystem[[6]], r > 8, colorsystem[[5]], r > 6,
colorsystem[[4]], r > 4, colorsystem[[3]], r > 2, colorsystem[[2]],
True, colorsystem[[1]]];
colors = If[# > 0, hotcolor[#], White] & /@ rate;
maps = Transpose[{counties, colors}];
Graphics[{EdgeForm[
LightGray], {FaceForm[#[[2]]], Polygon[#[[1, 2]]]} & /@ maps,
Thick, White, Line[statelines]}, ImageSize -> 1200]