Message Boards Message Boards

Graphing a Mandelbulb with Wolfram Language

Posted 8 years ago

Hello!

I am new with Mathematica and I am constructing a Mandelbulb fractal with Mathematica but when I Graph it, it won't graph it as how other websites show the Mandelbulb. Let me give you some examples:

These are with power=8:

enter image description here

enter image description here

These are with power=2:

enter image description here

enter image description here


CODE

Mandelbulb[c_] := 
 Module[{o = 1, n = 8, newx = x, newy = y, newz = z, 
   r = Sqrt[x*x + y*y + z*z]},
         While[o < 400 &&
             r <= 2,
   theta = ArcTan[Sqrt[newx*newx + newy*newy], newz];
   phi = ArcTan[newy, newx];
   newx = r^n*Sin[theta*n]*Cos[phi*n] + x;
   newy = r^n*Sin[theta*n]*Sin[phi*n] + y;
           newz = r^n*Cos[theta*n] + z;
   r = Sqrt[newx*newx + newy*newy + newz*newz];
                  o = o + 1];
                   o]
DensityPlot3D[Mandelbulb[x + y*I], {x, -1.5, 1.5}, {y, -1.5, 1.5}, {z, -1.5, 1.5}]

My guess is that I am using DenityPlot3D and I can be using a better graphing command

Thank you very much for your time!!!

POSTED BY: Eduardo Carrera
5 Replies

Sander Huisman Yes, thanks for writing this program. This code runs very well on my machine. It is better than the code Paul Nylander wrote by the compile and ParallelTable which make the program run rapidly , even on my old machine in version #9. Roger Bagula

POSTED BY: Roger L. Bagula

If you run my code with 300 points in each directions:

n = 300;
pts = Subdivide[-1.5, 1.5, n];
AbsoluteTiming[vals = ParallelTable[cf[x, y, z], {x, pts}, {y, pts}, {z, pts}];]
Times @@ Dimensions[vals]
ListContourPlot3D[vals, Contours -> {20}, Mesh -> None]

enter image description here

you will see some more details...

POSTED BY: Sander Huisman

Thank you very much!!

That is exactly what I wanted, May you explain the code more deeply? I am doing this work just to practice and learn more about Mathematica.

Cheers!

POSTED BY: Eduardo Carrera

It seems to me it need to be pixels or voxels for better resolution control. While this is done with GPU:

Generate a Mandelbulb Set with CUDA Functionality

the final rendering function is 2D and is just Image

enter image description here

I think the same was used in this video:

Fractals in Mathematica with OpenCL

enter image description here

so they sort of compute a 2D projection and guarantee a high res image.

POSTED BY: Sam Carrettie

I'm not sure if Mathematica is the right tool to make these plots, but well we can try. First we can compile and optimize your code a bit:

ClearAll[cf,cfg]
cf=Compile[{{x, _Real},{y, _Real},{z, _Real}},
    Module[{o=1,n=8,newx=x,newy=y,newz=z,rsq=x x+y y+z z,theta,phi},
        While[o<400&&rsq<=4,
            If[newz==0.0,newz=0.000001];
            If[newz==0.0,newx=0.000001];
            If[newy==0.0,newy=0.000001];
            theta=n ArcTan[Sqrt[newx*newx+newy*newy],newz];
            phi=n ArcTan[newy,newx];
            rsq=rsq^(n/2);
            newx=rsq Sin[theta]Cos[phi]+x;
            newy=rsq Sin[theta]Sin[phi]+y;
            newz=rsq Cos[theta]+z;
            rsq=newx newx+newy newy+newz newz;
            o=o+1
        ];
    o
    ]
]
cfg[x_?NumberQ,y_?NumberQ,z_?NumberQ]:=cf[x,y,z]

Compared to your uncompiled version it is 11x faster:

RepeatedTiming[Mandelbulb[0.1, 0.1, 0.1], 2]
RepeatedTiming[cf[0.1, 0.1, 0.1], 2]
RepeatedTiming[cfg[0.1, 0.1, 0.1], 2]
0.0056
0.00052
0.00053

on my machine...

n = 45;
pts = Subdivide[-1.5, 1.5, n];
AbsoluteTiming[
 vals = Table[cf[x, y, z], {x, pts}, {y, pts}, {z, pts}];]
Times @@ Dimensions[vals]
ListContourPlot3D[vals, Contours -> {20}, Mesh -> None]

Now we use ContourPlot rather than DensityPlot to get a surface:

enter image description here

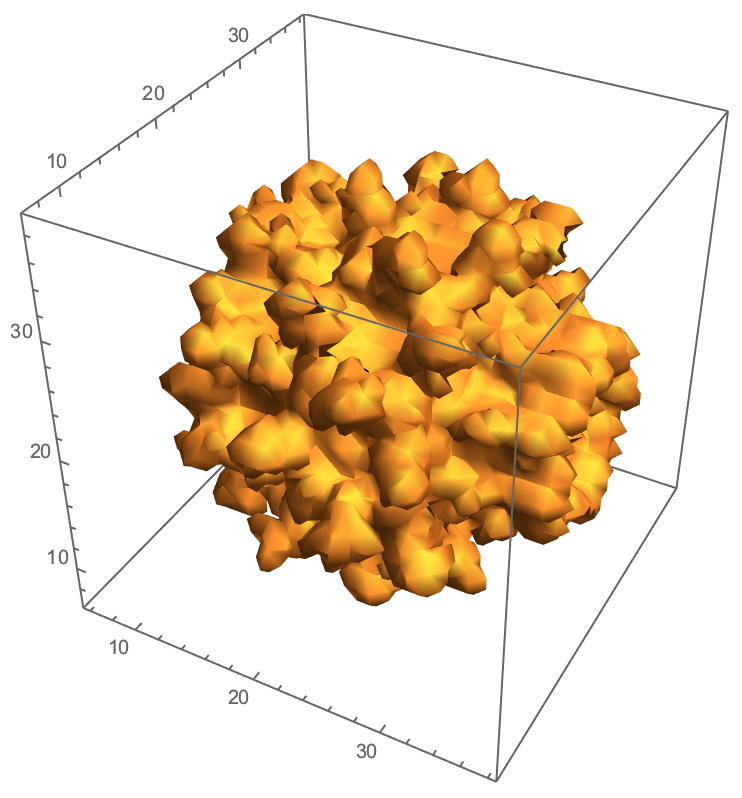
With already a much better result, and only in 4 seconds (my laptop). Again, I'm not sure if Mathematica is the right tool, but with some optimisations it might be possible.

POSTED BY: Sander Huisman
Reply to this discussion
Community posts can be styled and formatted using the Markdown syntax.
Reply Preview
Attachments
Remove
or Discard

Group Abstract Group Abstract